September 2008
TRADERS' TIPS
You can copy these formulas and programs for easy use in your spreadsheet or analysis software. Simply "select" the desired text by highlighting as you would in any word processing program, then use your standard key command for copy or choose "copy" from the browser menu. The copied text can then be "pasted" into any open spreadsheet or other software by selecting an insertion point and executing a paste command. By toggling back and forth between an application window and the open Web page, data can be transferred with ease.
This month's tips include formulas and programs for:
METASTOCK: MIDAS INDICATOR
TRADESTATION: MIDAS INDICATOR
eSIGNAL: MIDAS INDICATOR
WEALTH-LAB: MIDAS INDICATOR
AMIBROKER: MIDAS INDICATOR
NEUROSHELL TRADER: MIDAS INDICATOR
CQG: MIDAS INDICATOR
TD AMERITRADE'S STRATEGY DESK: MIDAS INDICATOR
AIQ: MIDAS INDICATOR
TRADERSSTUDIO: MIDAS INDICATOR
NEOTICKER: MIDAS INDICATOR
STRATASEARCH: MIDAS INDICATOR
MULTICHARTS: MIDAS INDICATOR
NINJATRADER: MIDAS INDICATOR
VT TRADER: MIDAS INDICATOR
INVESTOR/RT: MIDAS INDICATOR
or return to Sepember 2008 Contents
METASTOCK: MIDAS INDICATOR
Note: Code for the MIDAS indicator in MetaStock and MetaStock Pro was already provided in sidebars to Andrew Coles's article in this issue, "The MIDAS Touch, Part 1."
TRADESTATION: MIDAS INDICATOR
In his article in this issue ("Examining The VWAP Approach: The Midas Touch, Part 1"), Andrew Coles draws on previous market analysis work done by Paul Levine and George Reyna. He proposes certain calculations for the creation of a set of price support and resistance curves. We have developed EasyLanguage code to allow the calculated values described by Coles to be plotted on price charts (Figure 1).
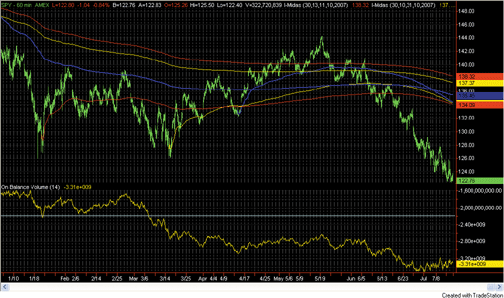
FIGURE 1: TRADESTATION, MIDAS INDICATOR. In this sample TradeStation chart, the MIDAS indicator is applied to an hourly chart of SPY. The indicator has been applied to the chart six times, using various starting dates as inputs. The indicator starting dates shown here are 10/11/2007, 10/31/2007, 12/11/2007, 1/23/2008, 3/17/2008, and 4/15/2008.To download the EasyLanguage code for this study, go to the TradeStation and EasyLanguage Support Forum (https://www.tradestation.com/Discussions/forum.aspx? Forum_ID=213). Search for the file "ColesMidas.ELD."
This article is for informational purposes. No type of trading or investment
recommendation, advice, or strategy is being made, given, or in any manner
provided by TradeStation Securities or its affiliates.
Indicator:  Midas
inputs:
    StartTime( 930 ),
    StartMonth( 1 ),
    StartDay( 1 ),
    StartYear( 2008 ) ;
variables:
    StartCalcDate( 0 ),
    VolumeValue( 0 ),
    MedPrice( 0 ),
    PV( 0 ),
    CumulativeVolume( 0 ),
    CumulativePV( 0 ),
    Started( false ),
    Denom( 0 ),
    KeyCumVol( 0 ),
    KeyCumPV( 0 ),
    MidasValue( 0 ) ;
if CurrentBar = 1 then
    StartCalcDate = ELDate( StartMonth, StartDay,
     StartYear ) ;
{ Midas Calculation }
if Date >= StartCalcDate and Time >= StartTime then
    begin
    VolumeValue = iff( BarType <= 1, Ticks, Volume ) ;
    MedPrice = MedianPrice ;
    PV = MedPrice * VolumeValue ;
    CumulativeVolume = VolumeValue + CumulativeVolume ;
    CumulativePV = PV + CumulativePV ;
    end ;
if Started = false and ( ( Date >= StartCalcDate and
 Time >= StartTime ) and ( ( Time[1] < StartTime or
 Date[1] < StartCalcDate ) or Date[1] >
 StartCalcDate ) ) then
    begin
    Started = true ;
    Denom = 1 ;
    KeyCumVol = CumulativeVolume ;
    KeyCumPV = CumulativePV ;
    end
else if Denom >= 1 then
    Denom = CumulativeVolume - KeyCumVol ;
if Started then
    begin
    if Denom > 1 then
        MidasValue = ( CumulativePV - KeyCumPV ) /
         Denom
    else if Denom = 1 then
        MidasValue = MedPrice ;
    Plot1( MidasValue, "Midas" ) ;
    end ;
--Mark MillsGO BACK
TradeStation Securities, Inc.
www.TradeStation.com
eSIGNAL: MIDAS INDICATOR
For this month's Traders' Tip, we've provided the eSignal formula Midas.efs based on the code given in Andrew Coles's article in this issue, "The MIDAS Touch, Part 1." The study contains two formula parameters that may be configured through the Edit Studies option to set the start date and time for the indicator.
A sample chart is shown in Figure 2.

Figure 2: eSIGNAL, MIDAS INDICATOR. This sample eSignal chart shows the MIDAS indicator on a daily chart of CL #F starting on 1/2/2008.To discuss this study or download a complete copy of the formula code, please visit the EFS Library Discussion Board forum under the Forums link at www.esignalcentral.com or visit our EFS KnowledgeBase at www.esignalcentral.com/support/kb/efs/. The eSignal formula scripts (EFS) are also available for copying and pasting from the STOCKS & COMMODITIES website at Traders.com.
/*********************************
Provided By:
    eSignal (Copyright © eSignal), a division of Interactive Data
    Corporation. 2007. All rights reserved. This sample eSignal
    Formula Script (EFS) is for educational purposes only and may be
    modified and saved under a new file name.  eSignal is not responsible
    for the functionality once modified.  eSignal reserves the right
    to modify and overwrite this EFS file with each new release.

Description:        The Midas Touch Part I
                    by Andrew Coles, PhD
Version:            1.0  7/11/2008
Notes:
* September 2008 Issue of Stocks and Commodities Magazine
* Study requires version 8.0 or later.
Formula Parameters:                     Default:
Start Date (mm/dd/yyyy)                 1/2/2008
Start Time hh:mm (use 00:00 if Daily)   00:00
**********************************/
function preMain(){
    setPriceStudy(true);
    setStudyTitle("MIDAS")
    setCursorLabelName("MIDAS");
    setDefaultBarFgColor(Color.blue);
    setDefaultBarThickness(1);

    var fp1 = new FunctionParameter("StartDate", FunctionParameter.STRING);
        fp1.setName("Start Date (mm/dd/yyyy)");
        fp1.setDefault("1/2/2008");
    var fp2 = new FunctionParameter("StartTime", FunctionParameter.STRING);
        fp2.setName("Start Time hh:mm (use 00:00 if Daily)");
        fp2.setDefault("00:00");
}
var bVersion    = null;
var bInit = false;
var xDay;
var xMonth;
var xYear;
var xHour;
var xMinute;
var xMP = null;
var xVolume = null;
var CumVol = 0;
var CumVol_1 = 0;
var CumPriceVol = 0;
var CumPriceVol_1 = 0;
var CumVolAtStart = 0;
var CumPriceVolAtStart = 0;
var BarCounter = 0;
var Start = false;
function main(StartDate,StartTime){
    if (bVersion == null) bVersion = verify();
    if (bVersion == false) return;
    if(bInit==false){
        var xStartDate = StartDate.split("/");
        var xStartTime = StartTime.split(":")
        xMonth = xStartDate[0];
        xDay = xStartDate[1];
        xYear = xStartDate[2];
        xHour = xStartTime[0];
        xMinute = xStartTime[1];
        xMP = hl2();
        xVolume = volume();
        bInit = true;
    }
    var nBarState = getBarState();
    if(nBarState==BARSTATE_NEWBAR){
        CumVol_1 = CumVol;
        CumPriceVol_1 = CumPriceVol;
        if(Start==true) BarCounter++;
    }
    var nVolume = xVolume.getValue(0);
    var nMP = xMP.getValue(0);
    if(nVolume==null||nMP==null) return;
    if(getCurrentBarCount()==1){
        CumVol = nVolume;
        CumPriceVol = nMP*nVolume;
    }else{
        CumVol = CumVol_1+nVolume;
        CumPriceVol = CumPriceVol_1+(nMP*nVolume);
    }
    if(Start==false && month(0)==xMonth && day(0)==xDay && year(0)==xYear
       && hour(0)==xHour && minute(0)==xMinute) {
        CumVolAtStart = CumVol-nVolume;
        CumPriceVolAtStart = CumPriceVol-(nMP*nVolume);
        BarCounter=1;
        Start = true;
    }
    if(BarCounter==0){
        return;
    }else if(BarCounter==1){
        var MIDAS = nMP;
    }else if(BarCounter>1){
        var Denom = CumVol-CumVolAtStart;
        if(Denom==0) Denom = 1;
        var MIDAS = (CumPriceVol-CumPriceVolAtStart)/Denom
    }
    return MIDAS;
}

function verify() {
    var b = false;
    if (getBuildNumber() < 779) {
        drawTextAbsolute(5, 35, "This study requires version 8.0 or later.",
            Color.white, Color.blue, Text.RELATIVETOBOTTOM|Text.RELATIVETOLEFT|Text.BOLD|Text.LEFT,
            null, 13, "error");
        drawTextAbsolute(5, 20, "Click HERE to upgrade.@URL=https://www.esignal.com/download/default.asp",
            Color.white, Color.blue, Text.RELATIVETOBOTTOM|Text.RELATIVETOLEFT|Text.BOLD|Text.LEFT,
            null, 13, "upgrade");
        return b;
    } else {
        b = true;
    }
    return b;
}
--Jason Keck
eSignal, a division of Interactive Data Corp.
800 815-8256, www.esignalcentral.com
WEALTH-LAB: MIDAS INDICATOR
We've now added the MIDAS indicator to our collection of drag-and-drop indicators (Figure 3, inset), based on "The MIDAS Touch, Part 1" by Andrew Coles in this issue.
By including the starting bar number as a parameter, the indicator is fully programmable, and our script demonstrates how a number of MIDAS curves can be effortlessly added to a chart for quick viewing. The script plots five MIDAS indicators for the most-recent 7% peaks and troughs (Figure 3).
FIGURE 3: WEALTH-LAB, MIDAS INDICATOR. The indicators were plotted here automatically by programming a simple peak/trough search and using the bar number results to obtain a new MIDAS indicator.
WealthScript code:
// Code for Execute method
// Don't forget to add: using TASCIndicators;
const int c = 6;
const double pct = 7d;
Color[] color = new Color[c];
color[0] = Color.Blue;
color[1] = Color.Red;
color[2] = Color.BlueViolet;
color[3] = Color.Fuchsia;
color[4] = Color.Green;
DataSeries ap = AveragePrice.Series(Bars);
DataSeries pbSer = PeakBar.Series(ap, pct, PeakTroughMode.Percent);
DataSeries tbSer = TroughBar.Series(ap, pct, PeakTroughMode.Percent);
int bar = Bars.Count - 1;
int n = 0;
while (bar > 1 && n < c)
{
   int pb = (int)pbSer[bar];
   int tb = (int)tbSer[bar];
   bar = Math.Max( pb, tb );
   DataSeries midas = Midas.Series(Bars, bar);
   PlotSeries(PricePane, midas, color[n], LineStyle.Solid, 2);
   n += 1;
   bar -= 1;
}
-- Robert Sucher
www.wealth-lab.com
AMIBROKER: MIDAS INDICATOR
In "Examining The VWAP Approach: The MIDAS Touch, Part 1" in this issue, author Andrew Coles presents a variant of the volume-weighted average price indicator. Coding the MIDAS indicator is very easy and straightforward in AmiBroker.
Listing 1 shows a ready-to-use formula for both end-of-day and intraday charts. When using it for end-of-day charts, simply leave the time setting untouched. The single formula allows up to five MIDAS plots starting from different dates/times. If you need more, simply replace the number 5 in the "for" loop with any numeral of your choice.
To use the code, simply enter it in the Formula Editor, then choose
the Tools->Apply Indicator menu from the editor. You can use the parameters
window (available from the right-click menu) to set the starting date/time
for MIDAS plots.
LISTING 1
Plot( C, "Price " + Date(), colorBlack, styleCandle );
for( i = 1; i <= 5; i++ )
{
 startdate = ParamDate("Starting Date " + i, "2000-01-01");
 starttime = ParamTime("Starting Time " + i, "00:00:00" );
 start = DateNum() < startdate AND TimeNum() <= starttime;
 mp = (H+L)/2;
 pv = Volume * mp;
 denom = Cum( V ) - ValueWhen( start, Cum( V ) );
 nom = Cum( pv ) - ValueWhen( start, Cum( pv ) );
 midas = IIf( BarsSince( start ), nom/denom, Null );
 Plot( midas, "Midas" + i, colorRed + i, styleLine | styleThick | styleNoRescale );
}
A sample chart is shown in Figure 4.

FIGURE 4: AMIBROKER, MIDAS INDICATOR. Here is a daily chart of OIL with two MIDAS lines. You can use the parameter window to adjust starting dates of up to five MIDAS indicators.--Tomasz Janeczko, AmiBroker.com
www.amibroker.com
NEUROSHELL TRADER: MIDAS INDICATOR
The MIDAS indicator described by Andrew Coles in "The MIDAS Touch, Part
1" in this issue can be easily implemented in NeuroShell Trader by combining
a few of NeuroShell Trader's 800+ indicators. Select "New Indicator …"
from the Insert menu and use the Indicator Wizard to create the following
indicators:
BARNUM:
    CumSum(Add2(1,0),0)
BARVOLUME:
If ThenElse(A>=B( BARNUM, StartBar# ), Volume, 0 )
MIDAS:
Divide( CumSum( Multiply2( Avg2( High, Low), BARVOLUME ), 0 ), CumSum(BARVOLUME, 0 ) )
As described in the article, the MIDAS indicator should only begin
computing after clear reversals in trend as identified visually on the
price chart. The MIDAS indicator formula given above accomplishes this
by beginning computation on the bar number identified by the StartBar#
parameter. To determine an appropriate StartBar# value, insert the Barnum
indicator on your chart and set the MIDAS indicator's StartBar# to the
Barnum indicator's value at a visually identified trend reversal.
A sample chart is shown in Figure 5. For more information on NeuroShell Trader, visit www.NeuroShell.com.

FIGURE 5: NEUROSHELL TRADER, MIDAS INDICATOR--Marge Sherald, Ward Systems Group, Inc.
301 662-7950, sales@wardsystems.com
www.neuroshell.com
CQG: MIDAS INDICATOR
Here is a CQG custom study definition based on the article, "Examining
The VWAP Approach: The Midas Touch, Part 1" by Andrew Coles. A sample chart
is shown in Figure 6.

FIGURE 6: CQG, MIDAS INDICATORThe study shown here matches the Excel spreadsheet calculations used in George Reyna's 2001 STOCKS & COMMODITIES article "Volume-Weighted Average Price For Support And Resistance" referenced in Coles's article in this issue.
A CQG component pac is available at the CQG website (https://www.cqg.com/Support/Downloads.aspx) for installing this study in CQG./* 1) Create Parameters:...... month...day....year...hour and minute.....These are case sensitive. 2) Check the overlaid box when creating this custom study. 3) Add to chart ...right click to modify... set display scale to ON from AUTO 4) In addition, to recreate this study you will need to add a temporary parameter called PeriodForSummation, insert into the sum function, then delete this from list of parameters.*/ DailyTime:= Month(@)=month AND Day(@)=day AND Year(@)=year; IntraDayTime:= Hour(@)=hour AND Minute(@)=minute; Time:= IF( BarInterval(@,none) < BarInterval(@,D), DailyTime AND IntraDayTime, DailyTime); PeriodForSummation:= BarsSince(Time,1,10000)+1; CumVol:= Sum(Vol(@),PeriodForSummation); CumMidAndVol:= Sum(Mid(@)* Vol(@),PeriodForSummation); VolOnDayOne:= Vol(@) WHEN PeriodForSummation=1; MidVolOnDayOne:=CumMidAndVol WHEN PeriodForSummation=1; MidasVWAP:= IF(PeriodForSummation = 1, Mid(@), (CumMidAndVol-MidVolOnDayOne)/(CumVol-VolOnDayOne));
--Thom Hartle
www.CQG.com
TD AMERITRADE'S STRATEGY DESK: MIDAS INDICATOR
In his article in this issue, "Examining The VWAP Approach: The MIDAS Touch, Part 1," Andrew Coles highlights a trading system using volume-weighted average price (VWAP) calculations. This system, developed by the late physicist and technical analyst Paul Levine, can be used to create support and resistance curves that can apply to both short and long-term time frames. Here is an interpretation using TD Ameritrade's StrategyDesk.
In the article, Coles discusses how volume-weighted average price can
be used to identify support and resistance curves following a clear trend
reversal. Using StrategyDesk, these curves can be created as custom chart
studies using the volume-weighted moving average formula shown here. Again,
since this system is based on a reversal in trend, we must be mindful of
the reversal's starting point.
(Bar[Date,D] = 20080617) * (MovingAverage[VWMA,High,1,0,D] +
MovingAverage[VWMA,Low,1,0,D]) / 2 + (Bar[Date,D] = 20080618) *
(MovingAverage[VWMA,High,2,0,D] + MovingAverage[VWMA,Low,2,0,D]) / 2 +
(Bar[Date,D] = 20080619) * (MovingAverage[VWMA,High,3,0,D] +
MovingAverage[VWMA,Low,3,0,D]) / 2 + (Bar[Date,D] = 20080620) *
(MovingAverage[VWMA,High,4,0,D] + MovingAverage[VWMA,Low,4,0,D]) / 2 +
(Bar[Date,D] = 20080623) * (MovingAverage[VWMA,High,5,0,D] +
MovingAverage[VWMA,Low,5,0,D]) / 2 + (Bar[Date,D] = 20080624) *
(MovingAverage[VWMA,High,6,0,D] + MovingAverage[VWMA,Low,6,0,D]) / 2 +
(Bar[Date,D] = 20080625) * (MovingAverage[VWMA,High,7,0,D] +
MovingAverage[VWMA,Low,7,0,D]) / 2 + (Bar[Date,D] = 20080626) *
(MovingAverage[VWMA,High,8,0,D] + MovingAverage[VWMA,Low,8,0,D]) / 2 +
(Bar[Date,D] = 20080627) * (MovingAverage[VWMA,High,9,0,D] +
MovingAverage[VWMA,Low,9,0,D]) / 2 + (Bar[Date,D] = 20080630) *
(MovingAverage[VWMA,High,10,0,D] + MovingAverage[VWMA,Low,10,0,D]) / 2 +
(Bar[Date,D] = 20080701) * (MovingAverage[VWMA,High,11,0,D] +
MovingAverage[VWMA,Low,11,0,D]) / 2 + (Bar[Date,D] = 20080702) *
(MovingAverage[VWMA,High,12,0,D] + MovingAverage[VWMA,Low,12,0,D]) / 2 +
(Bar[Date,D] = 20080703) * (MovingAverage[VWMA,High,13,0,D] +
MovingAverage[VWMA,Low,13,0,D]) / 2
Using StrategyDesk, it is possible to track multiple support or
resistance curves at once, as new trends begin. As is also discussed in
Coles's article in this issue, an on-balance volume (OBV) indicator can
be applied to the chart. See Figure 7.

FIGURE 7: TD AMERITRADE STRATEGYDESK, MIDAS INDICATOR. Google Inc. (GOOG) experienced a reversal on June 17, the date we began to plot MIDAS on the daily chart shown here. A lower indicator has been added that identifies the on-balance volume (OBV) for the same period.If you have questions about this formula or functionality, please call TD Ameritrade's StrategyDesk help line at 800 228-8056, free of charge, or access the Help Center via the StrategyDesk application. StrategyDesk is a downloadable application free for all TD Ameritrade clients. Regular commission rates apply.
TD AMERITRADE and StrategyDesk do not endorse or recommend any particular trading strategy.
--Jeff Anderson
TD AMERITRADE Holding Corp.
www.tdameritrade.com
AIQ: MIDAS INDICATOR
The AIQ code for Andrew Coles's article, "The MIDAS Touch, Part 1," is shown here. The author's version of the indicator, which is a variation of a volume-weighted moving average, is oriented toward discretionary trading because it requires visual examination of a chart to determine the significant low and high dates that are then input manually into the indicator before it can be used.
I prefer to work with mechanical methods that can be backtested, so when I coded Coles's version of the indicator, I converted the indicator to an adaptive one (RD VWAP) that automatically finds the most recent high and low pivot dates and then plots the VWAP automatically from these dates. My version of the indicator will plot automatically on any chart and the only input required is the strength (bars on each side of the pivot).
To test the indicator, I devised a simple trading system based on a trend-following technique of buying when the close crosses above the VWAP adaptive indicator. I ran simulations using the NASDAQ 100 list of stocks. To run tests on a portfolio level, I used the following trade selection rules and capitalization rules: the trades were selected using 32-day Aiq relative strength, taking the top three strongest signals per day, 10% of capital per position, with a maximum of 10 open positions. Positions were exited on a reversing signal.
I was curious as to whether the new indicator would outperform a simple moving average crossover (SMACO) system. I used a moving average length equal to 2 times the strength parameter of the VWAP +1. I ran comparative tests over the period 10/15/2002 to 7/11/2008 using the same list of stocks and the same exit conditions, with the difference being in the indicator driving the entries and exits. On the long-only test comparison, shown in Figure 8, the RD VWAP adaptive system (blue line) showed almost identical results to the SMACO system (red line) on all the various metrics. The short-side-only test comparison (not shown) was also nearly identical to the standard moving average crossover system. For both systems, shorting the NASDAQ 100 stocks during the test period (which is mostly a bullish period) lost at the rate of 27% per year. Both of the systems need market timing and/or trend filters to make the short side work. A trend filter might reduce the drawdown from the long side as well.

FIGURE 8: AIQ, MIDAS INDICATOR. Here is a comparison of RD VWAP adaptive and SMACO systems (long only). The RD VWAP system showed no significant difference from the SMA system in a portfolio simulation using the NASDAQ 100 stocks.The code can be downloaded from the AIQ website at www.aiqsystems.com and also from www.tradersedge systems.com/traderstips.htm, or can be copied and pasted from the STOCKS & COMMODITIES website at Traders.com.
! MIDAS TOUCH AKA VWAP INDICATOR
! Author: Andrew Coles, PhD, TASC September 2008
! Coded by: Richard Denning 7/08/08
! INPUTS:
Month1 is 06. Day1 is 05.Year1 is 2008 .
Month2 is 03. Day2     is 17.Year2 is 2008 .
Month3 is    01. Day3 is 23. Year3 is 2008.
Month4 is 12. Day4     is 11.Year4 is 2007.
! VARIABLES
bars1     is OffSetToDate(month1,day1,year1).
bars2     is OffSetToDate(month2,day2,year2).
bars3     is OffSetToDate(month3,day3,year3).
bars4     is OffSetToDate(month4,day4,year4).
date1    is makedate(month1,day1,year1).
date2     is makedate(month2,day2,year2).
date3     is makedate(month3,day3,year3).
date4     is makedate(month4,day4,year4).
MP    is ([high]+[low])/2.
V    is [volume].
CPV1    is sum(MP * V,^bars1).
CPV2    is sum(MP * V,^bars2).
CPV3    is sum(MP * V,^bars3).
CPV4    is sum(MP * V,^bars4).
CV1    is sum(V,^bars1).
CV2    is sum(V,^bars2).
CV3    is sum(V,^bars3).
CV4    is sum(V,^bars4).
! DISCRETIONALRY INDICATORS TO PLOT:
VWAP1    is iff(reportdate()>date1 and CV1>0, CPV1 / CV1,MP).
VWAP2    is iff(reportdate()>date2 and CV2>0, CPV2 / CV2,MP).
VWAP3    is iff(reportdate()>date3 and CV3>0, CPV3 / CV3,MP).
VWAP4    is iff(reportdate()>date4 and CV4>0, CPV4 / CV4,MP).
! --------
RD VWAP ADAPTIVE INDICATOR--------

!! PIVOTS-TWO LOW AND TWO HIGH
! Coded by: Richard Denning 9/12/06
!COMMON SETUP INFORMATION
    periods is 252.     !Total look back period
    Define    strength     12.
!Number of bars on each side of pivot
    OTD         is Offsettodate(Month(),Day(),Year()).
    LowR         is LoVal([low],(2*strength)+1).
    LowM        is Val([low],strength).
    LS         if  LowR = LowM.
    HighR        is HiVal([high],(2*strength)+1).
    HighM         is Val([high],strength).
    HS         if  HighR = HighM.
!FIND FIRST PIVOT LOW
         LT1         is scanany(LS,periods) then OTD .
          LO1         is ^LT1 + Strength.
        LO1dte         is SetDate(LO1).
    LowLO1         is val([low],^LO1).

!FIND SECOND PIVOT LOW THAT IS BEFORE THE FIRST PIVOT LOW
    LT2         is scanany(LS,periods,LO1) then OTD.
    LO2         is ^LT2 + Strength.
         LO2dte         is SetDate(LO2).
        LowLO2         is val([low],^LO2).
!FIND FIRST PIVOT HIGH
         HT1        is scanany(HS,periods,0) then OTD .
          HO1        is ^HT1 + Strength.
    HO1dte         is SetDate(HO1).
    HighHO1         is val([high],HO1).

!FIND SECOND PIVOT HIGH THAT IS BEFORE THE FIRST PIVOT HIGH
    HT2         is scanany(HS,periods,HO1) then OTD.
    HO2         is ^HT2 + Strength.
    HO2dte        is SetDate(HO2).
    HighHO2         is val([high],HO2).
bars5    is min(LO1,HO1).
CPV5    is sum(MP * V,bars5).
CV5    is sum(V,bars5).
! RD VWAP INDICATOR TO PLOT:
VWAP5    is iff(CV5 <> 0, CPV5 / CV5,[close]).
!--------

! VWAP ADAPTIVE CROSSOVER SYSTEM:
HD  if hasdatafor(300)>=252.
!Long Entry rule:
   LEVWAP if HD and countof([close] > VWAP5,2)=2.
!Long Exit rule:
   LXVWAP if countof([close] < VWAP5,2)=2.
!Short Entry rule:
   SEVWAP if HD and countof([close] < VWAP5,2)=2.
!Short Exit rule:
   SXVWAP if countof([close] > VWAP5,2)=2.
! SIMPLE MOVING AVERAGE CROSSOVER SYSTEM:
!Long Entry rule:
   LEsma if HD and countof([close] > simpleavg([close],25),2)=2.
!Long Exit rule:
   LXsma if HD and countof([close] < simpleavg([close],25),2)=2.
!Short Entry rule:
   SEsma if HD and countof([close] < simpleavg([close],25),2)=2.
!Short Exit rule:
   SXsma if HD and countof([close] > simpleavg([close],25),2)=2.
--Richard Denning
richard.denning@earthlink.net
TRADERSSTUDIO: MIDAS INDICATOR
The TradersStudio code for Andrew Coles's article in this issue, "The MIDAS Touch, Part 1," is shown here.
The code for the author's version of the indicator, which is a variation of a volume-weighted moving average, is listed under the heading MIDAS Touch Indicator." Because I prefer to work with mechanical methods that can be backtested, I converted the indicator to an adaptive one (RD VWAP) that automatically finds the most recent high and low pivot dates and then plots the VWAP automatically from these dates. My version of the indicator will plot automatically on any chart and the only input required is the strength (bars on each side of the pivot).
I created a function to compute the RD VWAP, shown under the heading "RD VWAP Adaptive Moving Average." This function is called to create the indicator plot, shown under the heading "RD VWAP Adaptive Indicator." This indicator plots three VWAP moving averages. The fastest VWAP average starts from the most recent swing high or swing low. The second VWAP starts from the next most recent swing high or swing low pair. The third VWAP starts from the third most recent pair of swing high or swing low. The closer of the two in each pair set is used in each case. The RD VWAP indicator is shown in Figure 9 on a chart of crude oil.

FIGURE 9: TRADERSSTUDIO, THE MIDAS INDICATOR. Here is an example of the RD VWAP indicator shown on a reverse-adjusted chart of crude oil with a 12-bar pivot/swing bar strength in TradersStudio. The lines step when the indicator recognizes a newly formed pivot/swing point.To test the indicator, I devised a simple trading system based on a trend-following technique of buying when the close crosses above the VWAP adaptive indicator. The code for this system is shown under the heading "RD VWAP Adaptive System." For this test, I used the fastest of the three lines. I ran simulations using a diversified portfolio of reverse-adjusted futures contracts consisting of cotton, euro currency, copper, Japanese yen, natural gas, sugar, and 10-year T-note. To run tests on a portfolio level, I used one of the trade plans provided with the software called the TS_PercentMarginPlan. (The code for this is not shown since it is provided with the software.) This plan bases position sizing on the margin requirements for each futures contract. I used a 10% parameter, which means that I used only 10% of the available leverage on each contract. Positions were exited on a reversing signal.
I was curious as to whether the new indicator would outperform a simple moving average crossover (SMACO) system. (The code for the SMACO system is not shown but is posted at the websites mentioned below.) I used a moving average length equal to 2 times the strength parameter of the VWAP +1. I ran comparative tests over the period 12/24/1992 to 7/11/2008 using the same portfolio of futures and the same exit conditions, with the difference being in the indicator driving the entries and exits. The results of the tests are compared in the table in Figure 10, which shows the RD VWAP adaptive system performing somewhat better than the SMACO system on all the various metrics. The long side on both systems preformed considerably better than the short side. The RD VWAP indicator appears to be worthy of further research. The stepping nature of the RD VWAP might make it an excellent trailing stop.
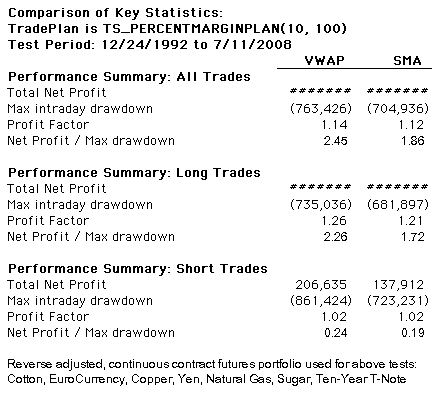
FIGURE 10: TRADERSSTUDIO, VOLUME-WEIGHTED ADAPTIVE PRICE SYSTEM VS. SIMPLE MOVING AVERAGE CROSSOVER SYSTEM. This table shows a comparison of the RD VWAP adaptive and SMACO systems: the RD VWAP system showed better metrics than the SMA system in a portfolio simulation trading a diversified portfolio of seven futures contracts.This code can be downloaded from the TradersStudio website at www.TradersStudio.com ->Traders Resources->FreeCode and also from www.tradersedgesystems.com/traderstips.htm.
' MIDAS TOUCH INDICATOR
' Author: Addrew Coles, PhD, TASC September 2008
' Coded by: Richard Denning 7/11/08
Sub MIDAS_I(date1, date2, date3, date4)
'date input format = ccyymmdd
Dim bars1,bars2,bars3,bars4,VWAP1,VWAP2,VWAP3,VWAP4 As BarArray
Dim MP, cumPV1, cumPV2, cumPV3, cumPV4 As Double
Dim cumV1, cumV2, cumV3, cumV4 As Double
MP = (H + L) / 2
'compute and plot line starting from date1
If Date > MigrateDate(date1) Then
    bars1 = bars1[1] + 1
    cumPV1 = summ(MP * V, bars1)
    cumV1 = summ(V, bars1)
    If cumV1 > 0 Then
        VWAP1 = cumPV1 / cumV1
        plot1(VWAP1)
    End If
Else
    bars1 = 0
End If
'Compute and plot line starting from date2:
If Date > MigrateDate(date2) Then
    bars2 = bars2[1] + 1
    cumPV2 = summ(MP * V, bars2)
    cumV2 = summ(V, bars2)
    If cumV2 > 0 Then
        VWAP2 = cumPV2 / cumV2
        plot2(VWAP2)
    End If
Else
    bars2 = 0
End If
'Compute and plot line startgin from date3:
If Date > MigrateDate(date3) Then
    bars3 = bars3[1] + 1
    cumPV3 = summ(MP * V, bars3)
    cumV3 = summ(V, bars3)
    If cumV3 > 0 Then
        VWAP3 = cumPV3 / cumV3
        plot3(VWAP3)
    End If
Else
    bars3 = 0
End If
'Compute and plot line starting form date4:
If Date > MigrateDate(date4) Then
    bars4 = bars4[1] + 1
    cumPV4 = summ(MP * V, bars4)
    cumV4 = summ(V, bars4)
    If cumV4 > 0 Then
        VWAP4 = cumPV4 / cumV4
        plot4(VWAP4)
    End If
Else
    bars4 = 0
End If
End Sub
___________________________________________________________________
' RD VWAP ADAPTIVE MOVING AVERAGE (FUNCTION)
' Based on article by: Addrew Coles, TASC September 2008
' Author: Richard Denning
' Coded by: Richard Denning 7/12/08
Function VWAP_ADPT(strength,swBarNum)
' strength is swing high/low bar pivot strength; input as integer
'     Min value = 1, maxbarsback must be >= strength * 25
' swBarNum =1 use most recent swing high swing low bars, 2 next etc
'     Max value = 3
Dim bars1,bars2,bars3,length As Integer
Dim swHigh1,swHigh2,swHigh3,swLow1,swLow2,swLow3 As Integer
Dim VWAP1,VWAP2,VWAP3 As BarArray
Dim  avgP, cumPV1, cumPV2, cumPV3, cumV1, cumV2, cumV3 As Double
length = strength * 24
avgP = (H + L) / 2
swHigh1 = SwingHighBar(1, H, strength, length)
swHigh2 = SwingHighBar(2, H, strength, length)
swHigh3 = SwingHighBar(3, H, strength, length)
swLow1 = SwingLowBar(1, L, strength, length)
swLow2 = SwingLowBar(2, L, strength, length)
swLow3 = SwingLowBar(3, L, strength, length)
bars1 = Min(swHigh1,swLow1)
bars2 = Min(swHigh2,swLow2)
bars3 = Min(swHigh3,swLow3)
If bars1 > 0 And swBarNum = 1 Then
    cumPV1 = summ(avgP * V, bars1)
    cumV1 = summ(V, bars1)
    If cumV1 > 0 Then
        VWAP1 = cumPV1 / cumV1
        VWAP_ADPT = VWAP1
    End If
End If
If bars2 > 0 And swBarNum = 2 Then
    cumPV2 = summ(avgP * V, bars2)
    cumV2 = summ(V, bars2)
    If cumV2 > 0 Then
        VWAP2 = cumPV2 / cumV2
        VWAP_ADPT = VWAP2
    End If
End If
If bars3 > 0 And swBarNum = 3 Then
    cumPV3 = summ(avgP * V, bars3)
    cumV3 = summ(V, bars3)
    If cumV3 > 0 Then
        VWAP3 = cumPV3 / cumV3
        VWAP_ADPT = VWAP3
    End If
End If
End Function
_________________________________________________________________
' RD VWAP ADAPTIVE INDICATOR
' Based on article by: Addrew Coles, TASC September 2008
' Author: Richard Denning
' Coded by: Richard Denning 7/12/08
Sub RD_VWAP_I(strength As Integer)
' strength is swing high/low bar pivot strength; input as integer
'     Min value = 1, maxbarsback must be >= strength * 25
Dim VWAP1, VWAP2, VWAP3 As BarArray
Dim avgP As Double
VWAP1 = VWAP_ADPT(strength,1)
VWAP2 = VWAP_ADPT(strength,2)
VWAP3 = VWAP_ADPT(strength,3)
If BarNumber > 502 Then
    plot1(VWAP1)
    plot2(VWAP2)
    plot3(VWAP3)
Else
    plot1(avgP)
    plot2(avgP)
    plot3(avgP)
End If
End Sub
_____________________________________________________________________
' RD VWAP ADAPTIVE SYSTEM
' Based on article by: Addrew Coles, TASC September 2008
' Author: Richard Denning
' Coded by: Richard Denning 7/12/08
Sub VWAP_1P(strength As Integer, swBarNum As Integer, numXOs As Integer)
' strength is swing high/low bar pivot strength; input as integer
'     Min value = 1, maxbarsback must be >= strength * 25
' swBarNum =1 use most recent swing high swing low bars, 2 next etc
'     Max value = 3
' numXOs = 1 use first cross over for entry and exit signal
'        = 2 require two consecutive cross overs for signals
'     Min value = 1,  Max value = 2
If strength < 1 Then strength = 1
If swBarNum < 1 Then swBarNum = 1
If swBarNum > 3 Then swBarNum = 3
If numXOs < 1 Then numXOs = 1
If numXOs > 2 Then numXOs = 2
Dim VWAP As BarArray
VWAP = VWAP_ADPT(strength,1)
If BarNumber > 575 Then
    If numXOs = 1 Then
        'Long entry rule for single XOs:
        If C > VWAP And C[1] < VWAP[1] Then
        Buy("LE_VWAP_1P",1,0,Market,Day)
        End If
        'Long exit rule for single XOs:
        If C < VWAP Then
        ExitLong("LX_VWAP_1C","",1,0,Market,Day)
        End If
        'Short entry rule for single XOs:
        If C < VWAP And C[1] > VWAP[1] Then
        Sell("SE_VWAP_1P",1,0,Market,Day)
        End If
        'Short exit rule for single XOs:
        If C > VWAP Then
        ExitShort("SX_VWAP_1C","",1,0,Market,Day)
        End If
    End If
    If numXOs = 2 Then
         'Long entry rule for two bar XOs:
        If C > VWAP And C[1] > VWAP[1] And C[2] < VWAP[2] Then
        Buy("LE_VWAP_2P",1,0,Market,Day)
        End If
        'Long exit rule for two bar XOs:
        If C < VWAP And C[1] < VWAP[1] Then
        ExitLong("LX_VWAP_2C","",1,0,Market,Day)
        End If
        'Short entry rule for two bar XOs:
        If C < VWAP And C[1] < VWAP[1] And C[2] > VWAP[2] Then
        Sell("SE_VWAP_2P",1,0,Market,Day)
        End If
        'Short exit rule for two bar XOs:
        If C > VWAP and C[1] > VWAP[1] Then
        ExitShort("SX_VWAP_2C","",1,0,Market,Day)
        End If
    End If

End If
End Sub
--Richard Denning
richard.denning@earthlink.net
NEOTICKER: MIDAS INDICATOR
In "The MIDAS Touch, Part 1" in this issue, author Andrew Coles presents the MIDAS indicator to help identify support and resistance price levels for any instrument. This indicator can be written in NeoTicker using formula language (Listing 1) with one starting date/time parameter for both the daily and intraday calculation.
We've created an indicator in NeoTicker named "Tasc Formula I-MIDAS" with one parameter that accepts a datetime variable for the starting date and time of weighted average price calculation. The parameter field is set to datetime type. NeoTicker provides a selection user interface for entering the date and time correctly.
A sample chart is shown in Figure 11.
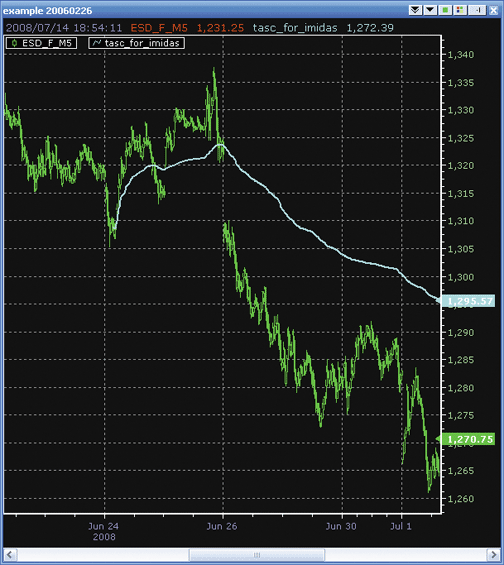
FIGURE 11: NEOTICKER, MIDAS INDICATORA downloadable version of this indicator will be available at the NeoTicker blog site (https://blog.neoticker.com).
LISTING 1
$pv := if(data1.datetime(0)>param1, $pv+typicalprice(data1)*v, typicalprice(data1)*v);
$denom := if(data1.datetime(0)>param1, $denom+v, v);
plot1 := if(data1.datetime(0)>param1, $pv/$denom, 0);
success1 := data1.datetime(0)>param1;
--Kenneth Yuen, TickQuest Inc.
www.tickquest.com
STRATASEARCH: MIDAS INDICATOR
Viewing the MIDAS support/resistance curves on multiple charts indicates they can be an effective approach. In fact, their success was fairly consistent from one symbol to another. However, the requirement to manually enter the starting dates for each MIDAS curve prevents the approach from being backtested very easily, so this is an approach that will likely be appreciated more by chartists than system traders.
As with all other Traders' Tips, additional information -- including plug-ins -- can be found in the Shared Area of the StrataSearch user forum. This month's plug-in contains a prebuilt custom formula and chart that will provide users with a template for exploring the MIDAS curves further.
A sample chart is shown in Figure 12.
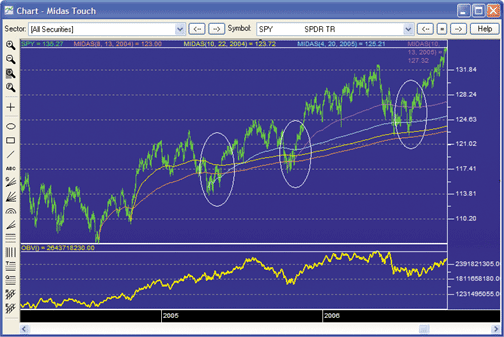
FIGURE 12: STRATASEARCH, THE MIDAS INDICATOR. As suggested by author Andrew Coles, the MIDAS curves provide helpful support/resistance lines. By the time the fourth support curve is in place (third ellipse), the support is very strong.
//***************************************
// MIDAS
//***************************************
// User defined input
sm=parameter("StartingMonth");
sd=parameter("StartingDay");
sy=parameter("StartingYear");
start= (sy*10000)+(sm*100)+sd;
// mid price
pv=MP()*V;
// Midas calculation
denom=If(accum(V)-ValueWhen(date=start, Accum(V)) = 0, 1, Accum(V)-ValueWhen(date=start, Accum(V)));
Midas = If(DaysSince(date=start),(Accum(pv)-ValueWhen(date=start,accum(pv)))/denom,MP());
--Pete Rast
Avarin Systems, Inc.
www.StrataSearch.com
MULTICHARTS: MIDAS INDICATOR
This Traders' Tip for MultiCharts is based on Andrew Coles's article in this issue, "The MIDAS Touch, Part 1."
We have created MIDAS in such a way that you will not have to worry about using the code for different resolutions. The script identifies the type of the chart and is then calculated accordingly. If you do not specify the input values, then, by default, the indicator is plotted from the very beginning. If you want to choose a specific swing high or low, just enter the year, month, day, hour, and minute in the regular format. The result of applying the indicator to MultiCharts as described in the article is demonstrated in Figure 13.
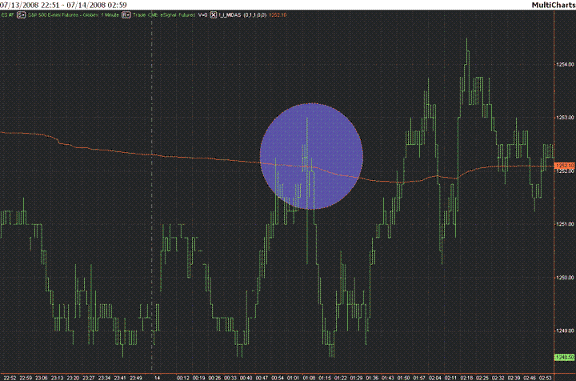
FIGURE 13: MULTICHARTS, MIDAS INDICATOR. Here is a sample chart of the emini S&P 500 continuous contract with the MIDAS indicator.
inputs:
    year_start(0),
    month_start(1),
    day_start(1),

    hour_start(0),
    minute_start(0);
variables:
    dateStart(0),
    timeStart(0),
    cumulativeVolume(0),
    startVolume(0),
    cumulativePriceOnVolume(0),
    startPriceOnVolume(0),
    MP(0),
    denom(0);
if ( month_start < 1 ) or ( month_start > 12 ) then
    raiseruntimeerror("Invalid Month input number. Diapason = 1..12");
if ( day_start < 1 ) or ( day_start > 31 ) then
    raiseruntimeerror("Invalid Day input number. Diapason = 1..31");
if ( hour_start < 0 ) or ( hour_start > 23 ) then
    raiseruntimeerror("Invalid Hour input number. Diapason = 1..23");
if ( minute_start < 0 ) or ( minute_start > 59 ) then
    raiseruntimeerror("Invalid Minute input number. Diapason = 1..59");
once value1 = (intportion(year_start) - 1900)*10000 + intportion(month_start)*100 + intportion(day_start);
once value2 = intportion(hour_start)*100 + intportion(minute_start);
MP = (high + low)*.5;
cumulativeVolume += volume;
cumulativePriceOnVolume += MP*volume;
if ( bartype > 1 and bartype < 5 ) then
    condition1 = date >= value1
else
    condition1 = ( date > value1 ) or ( date = value1 ) and ( time >= value2 );
if condition1 then
begin
    once startVolume = cumulativeVolume;
    once startPriceOnVolume = cumulativePriceOnVolume;
    if ( startVolume = cumulativeVolume ) then
        denom = 1
    else
        denom = cumulativeVolume - startVolume;
    if ( denom > 0 ) then
        value3 = ( cumulativePriceOnVolume - startPriceOnVolume )/denom;
    if ( startVolume = cumulativeVolume ) then
        value3 = MP;
    plot1(value3);
end;
To discuss this article or download a complete copy of the formulas,
please visit our discussion forum at forum.tssupport.com.
--Stanley Miller
TS SUPPORT, LLC
www.tssupport.com
NINJATRADER: MIDAS INDICATOR
The MIDAS and I-MIDAS indicators, as discussed in "Examining The VWAP Approach: The MIDAS Touch, Part 1" by Andrew Coles in this issue, are available for download at www.ninjatrader.com/SC/September2008SC.zip.
Once it has been downloaded, from within the NinjaTrader Control Center window, select the menu File > Utilities > Import NinjaScript and select the downloaded file. These indicators are for NinjaTrader version 6.5 or greater.
A sample chart is shown in Figure 14.
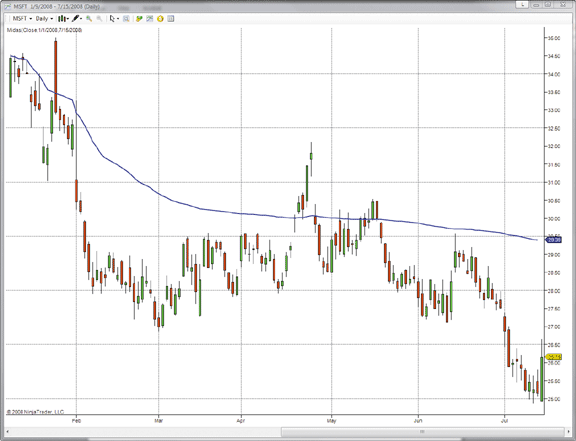
FIGURE 14: NINJATRADER, THE MIDAS INDICATOR. This NinjaTrader screenshot shows the MIDAS indicator applied on a daily chart of MSFT.You can review the indicator's source code by selecting the menu Tools > Edit NinjaScript > Indicator from within the NinjaTrader Control Center window and selecting either "Midas" or "I_Midas."
NinjaScript indicators are compiled DLLs that run native, not interpreted, to provide the highest performance possible.
--Raymond Deux, NinjaTrader, LLC
www.ninjatrader.com
VT TRADER: MIDAS INDICATOR
This Traders' Tip was inspired by the article "Examining The VWAP Approach: The MIDAS Touch, Part 1" by Andrew Coles in this issue. The VWAP support and resistance indicator (also known as the MIDAS indicator) was created by the late Paul Levine. The main goal of the MIDAS indicator is the prediction of major trend reversals using nonlinear support and resistance curves. The original MIDAS indicator was designed for use on long-term daily charts, but it has since been adapted for use on intraday charts.
We'll be offering two versions of the MIDAS indicator for download in our user forums; "Midas" is for use on the daily chart interval, while "I-MIDAS" is for use on the intraday chart intervals.
The VT Trader code and instructions for creating both versions of the
MIDAS indicator are as follows:
The Midas Indicator
1. Navigator Window>Tools>Indicator Builder>[New] button
2. In the Indicator Bookmark, type the following text for each field:
Name: TASC - 09/2008 - Midas
Short Name: vt_Midas
Label Mask: TASC - 09/2008 - Midas (Start Date: %sm%/%sd%/%sy%)
Placement: Price Frame
Inspect Alias: Midas
3. In the Input Bookmark, create the following variables:
[New] button... Name: sm , Display Name: Starting Month , Type: integer (with bounds) , Default: 1,
                Min Bounds: 1, Max Bounds: 12
[New] button... Name: sd , Display Name: Starting Day , Type: integer (with bounds) , Default: 1,
                Min Bounds: 1, Max Bounds: 31
[New] button... Name: sy , Display Name: Starting Year , Type: integer (with bounds) , Default: 2008
4. In the Output Bookmark, create the following variables:
[New] button...
Var Name: Midas
Name: (Midas)
Line Color: dark green
Line Width: slightly thicker
Line Type: solid
5. In the Formula Bookmark, copy and paste the following formula:
{Provided By: Visual Trading Systems, LLC & Capital Market Services, LLC (c) Copyright 2008}
{Description: The Midas Indicator}
{Notes: T.A.S.C., September 2008 - "The Midas Touch" by Andrew Coles, PhD}
{vt_Midas Version 1.0}
start:= sd=DayOfMonth() AND sm=Month() AND sy=Year();
pv:= MP() * V;
denom:= If(ValueWhen(1,start,Cum(V))=0, 1, Cum(V) - ValueWhen(1,start,Cum(V)));
midas:= (Cum(pv) - ValueWhen(1,start,Cum(pv))) / denom;
6. Click the "Save" icon to finish building the Midas indicator.
    To attach the indicator to a chart (Figure 15), click the right mouse button within the chart
    window and then select "Add Indicator" -> "TASC - 09/2008 ? Midas" from the indicator list.
The I-Midas Indicator
1. Navigator Window>Tools>Indicator Builder>[New] button
2. In the Indicator Bookmark, type the following text for each field:
Name: TASC - 09/2008 ? I-Midas
Short Name: vt_I_Midas
Label Mask: TASC - 09/2008 - I-Midas (Start Date/Time: %sm%/%sd%/%sy% %sh%:%se%)
Placement: Price Frame
Inspect Alias: I-Midas
3. In the Input Bookmark, create the following variables:
[New] button... Name: sm , Display Name: Starting Month , Type: integer (with bounds) , Default: 1,
                Min Bounds: 1, Max Bounds: 12
[New] button... Name: sd , Display Name: Starting Day , Type: integer (with bounds) , Default: 1,
                Min Bounds: 1 , Max Bounds: 31
[New] button... Name: sy , Display Name: Starting Year , Type: integer (with bounds) , Default: 2008
[New] button... Name: sh , Display Name: Starting Hour , Type: integer (with bounds) , Default: 1,
                Min Bounds: 0 , Max Bounds: 23
[New] button... Name: se , Display Name: Starting Minute , Type: integer (with bounds) , Default: 0 ,
                Min Bounds: 0 , Max Bounds: 59
4. In the Output Bookmark, create the following variables:
[New] button...
Var Name: I-Midas
Name: (I-Midas)
Line Color: dark blue
Line Width: slightly thicker
Line Type: solid
5. In the Formula Bookmark, copy and paste the following formula:
{Provided By: Visual Trading Systems, LLC & Capital Market Services, LLC (c) Copyright 2008}
{Description: The I-Midas Indicator}
{Notes: T.A.S.C., September 2008 - "The Midas Touch" by Andrew Coles, PhD}
{vt_I_Midas Version 1.0}
start:= sd=DayOfMonth() AND sm=Month() AND sy=Year() AND sh=Hour() AND se=Minute();
pv:= MP() * V;
denom:= If(ValueWhen(1,start,Cum(V))=0, 1, Cum(V) - ValueWhen(1,start,Cum(V)));
i_midas:= (Cum(pv) - ValueWhen(1,start,Cum(pv))) / denom;
6. Click the "Save" icon to finish building the I-Midas indicator.
To attach the indicator to a chart (Figure 16), click the right
mouse button within the chart window and then select "Add Indicator" ->
"TASC - 09/2008 ? I-Midas" from the indicator list.
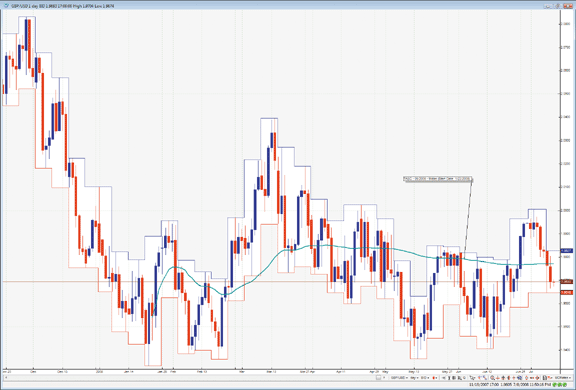
FIGURE 15: VT TRADER, THE MIDAS INDICATOR. Here is the MIDAS indicator on a daily chart.To learn more about VT Trader, visit www.cmsfx.com.
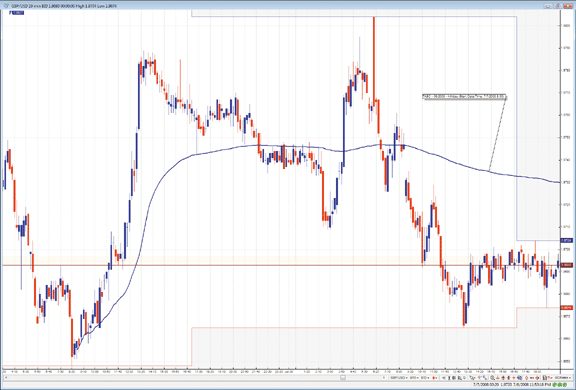
FIGURE 16: VT TRADER, THE MIDAS INDICATOR. Here is the MIDAS indicator on a GBP/USD 10-minute candlestick chart.
--Chris Skidmore
Visual Trading Systems, LLC (courtesy of CMS Forex)
(866) 51-CMSFX, trading@cmsfx.com
www.cmsfx.com
INVESTOR/RT: MIDAS INDICATOR
The Investor/RT implementation of the VWAP cumulative bands indicator provides an option to create cumulative VWAP lines originating at any user-specified date/time and continuing to the present, as demonstrated in Figure 17.
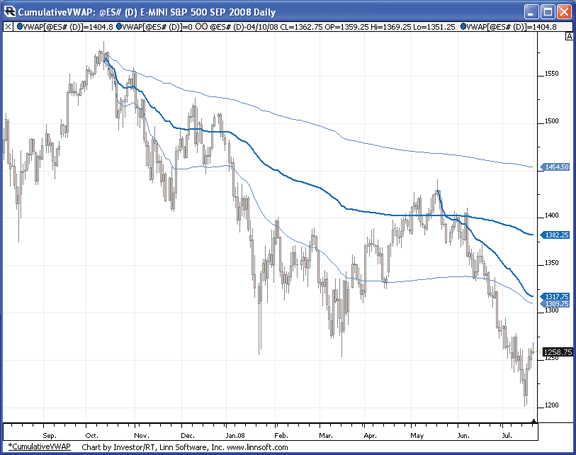
FIGURE 17: INVESTOR/RT, VOLUME-WEIGHTED AVERAGE PRICE INDICATOR. A daily chart of the S&P emini shows cumulative VWAP lines from key highs. These lines are drawn along with 1 standard deviation bands and can be used for areas of resistance.The dark blue lines show the cumulative VWAP, while the light blue lines represent 1 standard deviation bands above and below the VWAP.
These cumulative VWAP lines should be drawn from bars with extreme highs or lows and provide lines of resistance and support, respectively. These lines may be easily dragged and dropped to a new starting date/time, or they may be cloned by simply ctrl-dragging to any bar with an extreme relative high or low.
More information on the Investor/RT implementation of the VWAP indicator, along with video demonstrations, may be found at: https://www.linnsoft.com/tour/techind/VWAP.htm.
--Chad Payne
Linn Software
www.linnsoft.com, info@linnsoft.com

