Access to foreign exchange trading has opened up exciting trading options for the retail trader. You can now trade alongside corporations and institutions in a highly liquid market that is global, traded around the clock, and highly leveraged. Before jumping into this market, however, we must understand the factors that affect the forex market. With that in mind, STOCKS & COMMODITIES has introduced Forex Focus to better prepare the retail trader to participate in the currency market.
by James Chen, CTA
Here's an age-old charting technique that you can use effectively in the foreign exchange markets.
TO trade using point & figure charts is to trade based on pure price action. One of the best-kept secrets about this granddaddy of technical analysis charting methods lies in the fact that it is ideally suited to analyzing and trading the forex market.
THE BASICS
Point & figure (P&F) charts originated in the 19th century as an innovative method for graphically plotting price action in the financial markets. One of the unique aspects of P&F charting is that generally, only the most important aspect of technical analysis -- price -- is recorded on the charts. Unlike the more widely used bar or candlestick charts, P&F charts customarily exclude volume, time, and open/close delineations. After all of this is left out, that which remains is just the purity of price action. With only price as the sole analytical factor, P&F charts are uniquely capable of revealing a clearer, less muddled representation of such vital technical analysis dynamics as trend, support/resistance, and breakouts.
FOREX ANALYSIS WITH POINT & FIGURE
Point & figure charts are well-suited to analyzing forex for a number of reasons. As most forex traders are aware, the global foreign exchange markets are collectively open for business 24 hours a day, providing continuous price data for traders. Because of this, there are no true open or close demarcations on a daily basis when trading currencies. Any open or close data represented on popular bar and candlestick charting software is largely arbitrary. Each broker or market-maker appoints its own daily open/close time.
Candlestick charts in particular rely to a great extent on this data to provide their unique visual patterns and signals. P&F charts, on the other hand, have no need for open or close data. In fact, these charts work best with continuously streaming and active price data, which forex arguably provides better than any other financial trading market.
Another aspect in which P&F charts prove so well-suited to forex
trading lies in the exclusion of volume. Whereas equity charts traditionally
display a volume histogram running below price, P&F charts have no
place for volume. Point & figure purists reason that a price action
breakout is just that, regardless of the volume that accompanies it. And
as most forex traders are aware, there is no globally centralized exchange
in currency trading; therefore, there is no accurate means of assessing
marketwide volume data. So P&F charts focus exclusively upon the only
available and all-important data point in forex trading -- price.

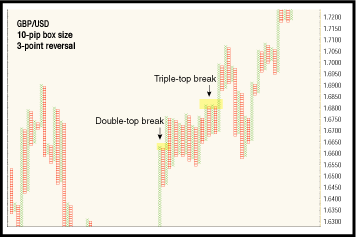
FIGURE 1: GBP/USD POINT & FIGURE CHART WITH TWO COMMON BREAKOUT PATTERNS
Originally published in the February 2008 issue of Technical Analysis
of
STOCKS & COMMODITIES magazine. All rights reserved. © Copyright
2008, Technical Analysis, Inc.
Return to February 2008 Contents