Over 60 Years Of Stock Market History
Can Technical Factors Gauge What Works In The Stock Market?
In the second part of this series we look at the technical factors you can use to gauge the magnitude and direction of the trends in the S&P 500.
Using only month-to-month, close-to-close figures, it is difficult to find any meaningful, consistent information in the price performance of the Standard & Poor's 500 itself by using technical analysis. This does not mean that technical analysis is useless, just that when looking at the monthly trend it is difficult to find exploitable patterns.
ARE DOWN YEARS FOLLOWED BY RISING ONES?
The rate of return indicator is one of the oldest and most robust gauges of the magnitude and direction of an asset's trend. Trend-followers will buy an asset whose rate of change is high and rising. Swing traders can use it as an oscillator, helping to identify periods when the asset is oversold (very negative) or overbought (very positive).
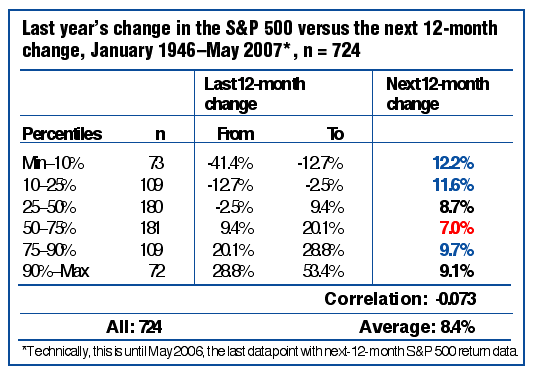
So in using a 12-month time frame, is the rate of change indicator useful for identifying periods of high or low subsequent 12-month changes in the S&P 500? The answer is: not really (Figure 1).

FIGURE 1: RATE OF CHANGE. The market's performance last year is only weakly and inversely correlated with its performance the following year....Continued in the February issue of Technical Analysis of STOCKS & COMMODITIES
Excerpted from an article originally published in the February 2008
issue of Technical Analysis of
STOCKS & COMMODITIES magazine. All rights reserved. © Copyright
2008, Technical Analysis, Inc.
Return to February 2008 Contents