Terms Of Trend Direction
Trading With The Directional Ratio
Whether you trade long term, short term, or intermediate term, you need to know the direction of the trend. Here's a simple way to find out.
IF you are an active trader, or if you manage traders, you probably already know the importance of differentiating between a "trend trade" and a "countertrend trade." By using the highs and lows on the chart to determine overall direction, it should be a simple matter to determine a market's current stance for a particular time period, be it 15 candles or 60. However, once you add up the long-, intermediate-, and short-term trends on the daily, 240-minute, and 60-minute charts, the moving parts start to blur.
UP, DOWN OR SIDEWAYS
To help gauge the trend on the different time frames, I break it down into simple numbers. There are three things a market can do: go up, go down, and go sideways; and there are three different time frames to do it in: long term, intermediate term, and short term. That's nine directional determinates, or a directional ratio, that when tabulated can help define trend trades versus countertrend trades at a glance. Imagine how this can help you in the decision-making process when scanning multiple markets on multiple time frames in search of familiar patterns and trade setups.
Figure 1 is an example of the directional ratio for the US dollars/Japanese yen (USD/JPY) on October 15, 2007. The chart simultaneously identifies the current trends -- long term, intermediate term, and short term -- on three different time frames -- daily, 240 minutes, and 60 minutes. In Figure 2 you see the ratio for the USD/JPY two days later.
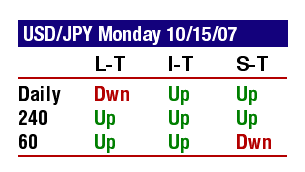
FIGURE 1: DIRECTIONAL RATIO FOR USD/JPY ON OCTOBER 15, 2007. A trade signal or trade setup is a trend trade if it is in the same direction as the next higher time frame.
...Continued in the February issue of Technical Analysis of STOCKS
& COMMODITIES
Excerpted from an article originally published in the February 2008
issue of Technical Analysis of
STOCKS & COMMODITIES magazine. All rights reserved. © Copyright
2008, Technical Analysis, Inc.
Return to February 2008 Contents