Where Do Indexes Reverse?
Those big round numbers have an influence on prices...sometimes great, and sometimes (surprisingly) not so great.
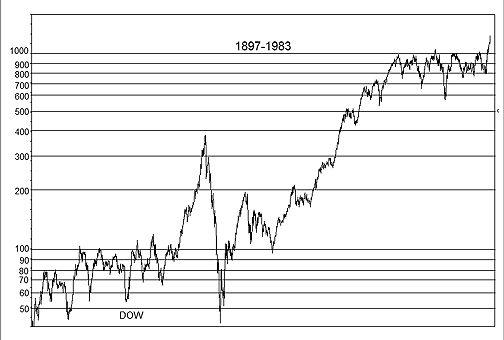
Big round numbers, those with a single digit followed by zeroes, obviously have an influence on prices, and most major reversals have occurred as a popular index was hitting one. The Dow Jones Industrial Average (DJIA) has long represented the market to most observers, and Figure 1 shows that near the turn of the last century, it reversed six times from the 100 level. After finally breaking above the resistance around 100, it passed through 200 and 300 to peak somewhere near 400. During the crash of 1929, there were brief bear rallies to near 300 and 200, and it bottomed near 40. After the crash, it rallied near 80, fell near 50, rebounded to 100, corrected to 90, rose near the next big round number of 200, and fell all the way back to 100. It then broke away and rose rapidly, correcting with small bear markets from 200, near 300, and 500. After nearing 1000, it repeated the experience at 100 by reversing into severe bear markets five times from that level.

FIGURE 1: DOW JONES INDUSTRIAL AVERAGE (1897-1983). Note the similarities in action between the DJIA when it hit 100 and when it hit 1000.
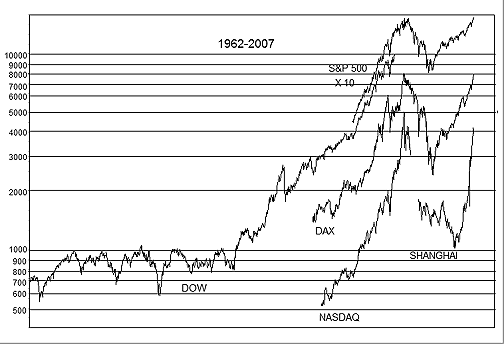
Figure 2 shows that nearly every peak or trough since 1962 occurred at
a time when a popular index was hitting or nearing a big round number.
Round numbers that are followed by different numbers of zeroes are considered
psychologically equivalent, and those providing the greatest resistance
or support are those beginning with "1." The DJIA peaked first when it
was nearing 1000 in 1966 and fell 25%.

FIGURE 2: DOW JONES INDUSTRIAL AVERAGE (1962-2007). Nearly every peak or trough since 1962 occurred at a time when a popular index was hitting or nearing a big round number.
It gradually recovered to peak again near 1000 in 1968, and fell 35%. It broke just above 1000 in 1973, peaked again, and fell to bottom just after penetrating 600. It rose again to bounce repeatedly just above 1000 in 1976 and fell 25%. It rose to peak at 1000 again in 1981, and bottomed with three lows near 800. It then broke above the resistance around 1000. In 1987, it passed through 2000, apparently being steered by traders in the new index futures toward a Fibonacci target around 2700. The DJIA nearing 3000 in 1990 was followed by a brief bear market. Nearing 4000 with the NASDAQ Composite hitting 800 was followed by the flat bear market of 1994.
The DJIA has not been sensitive to round numbers since then, including the 10000 level, probably because other indexes have gained popularity. The low of early 1994 occurred as the NASDAQ Composite hit 700. Its hitting 2000, with the German DAX hitting 6000, was followed by the 1998 plunge, and hitting 5000 along with the DAX hitting 8000 marked the market peak in 2000. The bear market of 2001-02 ended with the Standard & Poor's 500 at 800.
None of the main US indexes are currently near big round numbers, and the tendency between round numbers is to rise to the next one. However, the Shanghai Composite is hitting 4000, and the German DAX is hitting 8000. These markets have become leaders in speculation, though not in capitalization, and this combination could soon mark a peak.
William Ferree is the developer of the timing formula model, which uses a combination of statistical indicators deemed dependable and having a consistent correlation to the future. No commercial software was used to make the calculations seen in this article. The author is #rated for timing the Standard & Poor's 500 by Timer Digest over the past three years. Ferree may be reached at ferreemt@aol.com.
Originally published in the September 2007 issue of Technical Analysis
of STOCKS & COMMODITIES magazine. All rights reserved. © Copyright
2007, Technical Analysis, Inc.
Return to September 2007 Contents
Originally published in the September 2007 issue of Technical Analysis
of STOCKS & COMMODITIES magazine. All rights reserved. © Copyright
2007, Technical Analysis, Inc.