July 2007
TRADERS' TIPS
You can copy these formulas and programs for easy use in your spreadsheet or analysis software. Simply "select" the desired text by highlighting as you would in any word processing program, then use your standard key command for copy or choose "copy" from the browser menu. The copied text can then be "pasted" into any open spreadsheet or other software by selecting an insertion point and executing a paste command. By toggling back and forth between an application window and the open Web page, data can be transferred with ease.
This month's tips include formulas and programs for:
![]() TRADESTATION:
Volume Price Confirmation Indicator (VPCI)
TRADESTATION:
Volume Price Confirmation Indicator (VPCI)
![]() METASTOCK:
Volume Price Confirmation Indicator (VPCI)
METASTOCK:
Volume Price Confirmation Indicator (VPCI)
![]() eSIGNAL:
Volume Price Confirmation Indicator (VPCI)
eSIGNAL:
Volume Price Confirmation Indicator (VPCI)
![]() WEALTH-LAB:
Volume Price Confirmation Indicator (VPCI)
WEALTH-LAB:
Volume Price Confirmation Indicator (VPCI)
![]() AMIBROKER:
Volume Price Confirmation Iindicator (VPCI)
AMIBROKER:
Volume Price Confirmation Iindicator (VPCI)
![]() NEUROSHELL
TRADER: Volume Price Confirmation Indicator (VPCI)
NEUROSHELL
TRADER: Volume Price Confirmation Indicator (VPCI)
![]() NEOTICKER:
Volume Price Confirmation Indicator (VPCI)
NEOTICKER:
Volume Price Confirmation Indicator (VPCI)
![]() WORDEN'S
MODULAR TOOLS: Volume Price Confirmation Indicator (VPCI)
WORDEN'S
MODULAR TOOLS: Volume Price Confirmation Indicator (VPCI)
![]() TRADECISION:
Volume Price Confirmation Indicator (VPCI)
TRADECISION:
Volume Price Confirmation Indicator (VPCI)
![]() STRATASEARCH:
Volume Price Confirmation Indicator (VPCI)
STRATASEARCH:
Volume Price Confirmation Indicator (VPCI)
![]() AIQ:
Volume Price Confirmation Indicator (VPCI)
AIQ:
Volume Price Confirmation Indicator (VPCI)
![]() NINJATRADER:
Volume Price Confirmation Indicator (VPCI)
NINJATRADER:
Volume Price Confirmation Indicator (VPCI)
![]() TRADINGSOLUTIONS:
Volume Price Confirmation Indicator (VPCI)
TRADINGSOLUTIONS:
Volume Price Confirmation Indicator (VPCI)
![]() VT
TRADER: Volume Price Confirmation Indicator (VPCI)
VT
TRADER: Volume Price Confirmation Indicator (VPCI)
![]() SWINGTRACKER:
Volume Price Confirmation Indicator (VPCI)
SWINGTRACKER:
Volume Price Confirmation Indicator (VPCI)
![]() TRADE
NAVIGATOR: Volume Price Vonfirmation Indicator (VPCI)
TRADE
NAVIGATOR: Volume Price Vonfirmation Indicator (VPCI)
or return to July 2007 Contents
Editor's note: This month's Traders' Tips are based on Buff Dormeier's article in this issue, "Between Price And Volume."
The following code can be copied and pasted into the appropriate program. In addition, the code for each program is usually available at the respective software company's website. Thus, no retyping of code is required for Internet users.
TRADESTATION: Volume Price Confirmation Indicator (VPCI)
Buff Dormeier's article in this issue, "Between Price And Volume," describes calculation of the volume price confirmation indicator (VPCI) and suggests a strategy for trading with it.
The strategy consists of a moving average convergence-divergence (MACD) signal, which is confirmed based on readings of the VPCI. The article then compares the VPCI's value as a confirming indicator with on-balance volume (OBV) and average directional index (ADX). To perform this test, a strategy was created in EasyLanguage with "on-off" input switches, allowing the trader to select the desired confirming indicator.
Code for a VPCI indicator and strategy are given here. The indicator plots the raw and smoothed VPCI. The strategy uses Macd to generate trading signals, but it trades only if the selected confirming indicator agrees.
To download the code, go to the Support Center at TradeStation.com and
search for the file "VPCI.Eld."
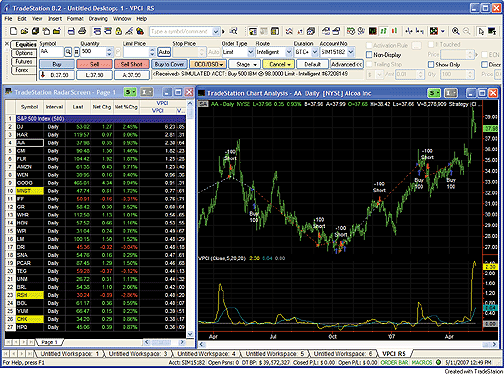
FIGURE 1: TRADESTATION, VPCI RADARSCREEN WINDOW AND STRATEGY. The left-hand window shows the VPCI statistics in RadarScreen. The right-hand window shows the VPCI strategy applied to a chart. Below the price chart is the VCPI indicator (yellow line).TradeStation does not endorse or recommend any particular strategy.
Indicator: VPCI
inputs:
    Price( Close ),
    Length1( 5 ),
    Length2( 20 ),
    VPCIAvgLen( 20 ) ;
variables:
    VolValue( 0 ),
    VolumeSum1( 0 ),
    VolumeSum2( 0 ),
    VWMA1( 0 ),
    VWMA2( 0 ),
    VP( 0 ),
    VPR( 0 ),
    VM( 0 ),
    VPCI( 0 ),
    AvgVPCI( 0 ) ;
if BarType >= 2 then { not tick/minute data }
    VolValue = Volume
else
    VolValue = Ticks ;

VolumeSum1 = Summation( VolValue, Length1 ) ;
if VolumeSum1 > 0 then
    VWMA1 = Summation( Price * VolValue , Length1 ) / VolumeSum1 ;
VolumeSum2 = Summation( VolValue, Length2 ) ;
if VolumeSum2 > 0 then
    VWMA2 = Summation( Price * VolValue , Length2 ) / VolumeSum2 ;
VP = VWMA2 - Average( Price, Length2 ) ;
VPR = VWMA1 / Average( Low, Length1 ) ;
VM = Average( VolValue, Length1 ) / Average( VolValue, Length2 ) ;
VPCI = VP * VPR * VM ;
AvgVPCI = Average( VPCI, VPCIAvgLen ) ;
Plot1( VPCI, "VPCI" ) ;
Plot2( AvgVPCI, "VPCISmooth" ) ;
Plot3( 0, "Zero" ) ;
Strategy:  VPCI
inputs:
    Price( Close ),
    Length1( 5 ),
    Length2( 20 ),
    VPCIAvgLen( 20 ),
    MACD_FastLength( 12 ),
    MACD_SlowLength( 26 ),
    MACDLength( 9 ),
    OBVAvgLength( 20 ),
    ADX_Len( 7 ),
    ADX_Threshold( 20 ),
     UseVPCI( 1 ), { 1 means "use for confirmation",
     0 means "don't use" }
    UseADX ( 0 ),
    UseOBV ( 0 ) ;
variables:
    MACDValue( 0 ),
    AvgMACD( 0 ),
    ADXValue( 0 ),
    OBVValue( 0 ),
    AvgOBV( 0 ),
    VolValue( 0 ),
    VolumeSum1( 0 ),
    VolumeSum2( 0 ),
    VWMA1( 0 ),
    VWMA2( 0 ),
    VP( 0 ),
    VPR( 0 ),
    VM( 0 ),
    VPCI( 0 ),
    AvgVPCI( 0 ) ;
MACDValue = MACD( Close, MACD_FastLength, MACD_SlowLength ) ;
AvgMACD = Average( MACDValue, MACDLength ) ;
ADXValue = ADX( ADX_Len ) ;
OBVValue = OBV ;
AvgOBV = Average( OBVValue, OBVAvgLength ) ;
if BarType >= 2 then { not tick/minute data }
    VolValue = Volume
else
    VolValue = Ticks ;

VolumeSum1 = Summation( VolValue, Length1 ) ;
if VolumeSum1 > 0 then
    VWMA1 = Summation( Price * VolValue , Length1 ) / VolumeSum1 ;
VolumeSum2 = Summation( VolValue, Length2 ) ;
if VolumeSum2 > 0 then
    VWMA2 = Summation( Price * VolValue , Length2 ) / VolumeSum2 ;
VP = VWMA2 - Average( Price, Length2 ) ;
VPR = VWMA1 / Average( Low, Length1 ) ;
VM = Average( VolValue, Length1 ) / Average( VolValue, Length2 ) ;
VPCI = VP * VPR * VM ;
AvgVPCI = Average( VPCI, VPCIAvgLen ) ;
if MACDValue crosses over AvgMACD
    and ( ( VPCI > AvgVPCI and UseVPCI = 1 ) or UseVPCI <> 1 )
    and ( ( ADXValue < ADX_Threshold and UseADX = 1 ) or
     UseADX <> 1 )
    and ( ( OBVValue > AvgOBV and UseOBV = 1 ) or UseOBV <> 1 )
then
    Buy next bar at market
else if MACDValue crosses under AvgMACD
    and ( ( VPCI < AvgVPCI and UseVPCI = 1 ) or
     UseVPCI <> 1 )
    and ( ( ADXValue < ADX_Threshold and UseADX = 1 ) or
     UseADX <> 1 )
    and ( ( OBVValue < AvgOBV and UseOBV = 1 ) or
     UseOBV <> 1 )
then
    SellShort next bar at market ;
--Mark Mills
TradeStation Securities, Inc.
A wholly-owned subsidiary of TradeStation Group, Inc.
www.TradeStation.com
METASTOCK: Volume Price Confirmation Indicator (VPCI)
Buff Dormeier's article in this issue, "Between Price and Volume," describes the calculation and use of the volume price confirmation indicator (VPCI). The formula for this indicator and the instructions for adding it to MetaStock are as follows:
To enter these indicators into MetaStock:
1. In the Tools menu, select Indicator Builder.
2. Click New to open the Indicator Editor for a new indicator.
3. Type the name of the formula.
4. Click in the larger window and type in the formula.
5. Click OK to close the Indicator Editor.
Name: Volume Price Confirmation Indicator
Formula:
x:=Input("long term periods",30,200,50);
y:=Input("short term periods",5,30,10);
(Mov(C,x,VOL)-Mov(C,x,S))*
(Mov(C,y,VOL)/Mov(C,y,S))*
(Mov(V,y,S)/Mov(V,x,S))
This indicator will prompt for the long- and short-term time periods. It
uses 50 and 10 as the defaults.
--William Golson
MetaStock Support Representative
Equis International (A Reuters Company)
801 265-9998, www.metastock.com
eSIGNAL: Volume Price Confirmation Indicator (VPCI)
In Buff Dormeier's article in this issue, "Between Price And Volume,"
we've provided the following three eSignal formulas: Vpci.efs, Vpci_Smoothed.efs,
and Vpci_Bollinger.efs (Figures 2, 3, and 4).
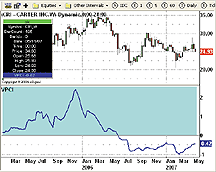
FIGURE 2: eSIGNAL, VPCI
FIGURE 3: eSIGNAL, VPCI SMOOTHED
FIGURE 4: eSIGNAL, VPCI WITH BOLLINGER BANDS
Formula parameters in each study may be configured through the Edit
Studies option in the Advanced Chart to change the number of periods for
the indicators as well as the color and thickness of the lines.
To discuss this study or download complete copies of the formulas, please visit the Efs Library Discussion Board forum under the Forums link at www.esignalcentral.com, or visit our EFS KnowledgeBase at www.esignalcentral.com/support/kb/efs/. The eSignal formula script (EFS) code is also available for copying and pasting from the STOCKS & COMMODITIES website at Traders.com [not shown here--Editor].
--Jason Keck
eSignal, a division of Interactive Data Corp.
800 815-8256, www.esignalcentral.com
WEALTH-LAB: Volume Price Confirmation Indicator (VPCI)
In the WealthScript code presented here, we chart Buff Dormeier's VPCI as if it were an MACD (line + signal + histogram). In fact, its Vpc+/- component is the difference of two moving averages: a "fast" one (volume-weighted averages tend to follow prices more closely than other averaging methods), and a "slow" one (while the other components are just scaling factors that would expand/compress VPC's dynamics). As a consequence, all trading signals that we are used to looking for in an MACD chart could be applied to a VPCI chart. In order to emphasize the concept and to easily detect similarities or differences between MACD and VPCI, we charted both (Figure 5) using the actual parameters as suggested by Dormeier in his article.
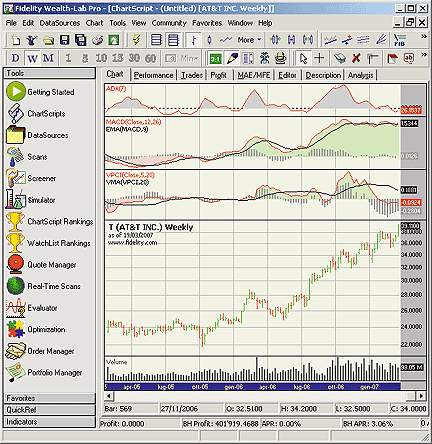
FIGURE 5: WEALTH-LAB, VPCI. Here is a visual comparison of VPCI vs. MACD.
WealthScript code:
// Indicator code (save as 'VPCI' into the Indicators folder)
function VPCISeries( Series, ShortPeriod, LongPeriod: integer ): integer;
begin
  var Name: string = 'VPCI(' + GetDescription( Series ) + ',' +
                IntToStr( ShortPeriod ) + ',' + IntToStr( LongPeriod ) + ')';
  Result := FindNamedSeries( Name );
  if Result >= 0 then exit;
  // Volume-price confirmation/contradiction
  var VPC: integer = SubtractSeries( VMASeries( Series, LongPeriod ),
                     SMASeries( Series, LongPeriod ) );
  // Volume-price ratio
  var VPR: integer = DivideSeries( VMASeries( Series, ShortPeriod ),
                     SMASeries( Series, ShortPeriod ) );
  // Volume multiplier
  var VM: integer = DivideSeries( SMASeries( #Volume, ShortPeriod ),
                     SMASeries( #Volume, LongPeriod ) );
  // Volume Price Confirmation Indicator
  Result := MultiplySeries( VPC, MultiplySeries( VPR, VM ) );
  SetDescription( Result, Name );
end;
function VPCI( Bar, Series, ShortPeriod, LongPeriod: integer ): float;
begin
  Result := GetSeriesValue( Bar,
                      VPCISeries( Series, ShortPeriod, LongPeriod ) );
end;
// ChartScript code (just a charting study)
{$I 'VPCI'}
{$I 'SeriesFillColor2'}
var Pane1: integer = CreatePane( 80, true, false );
var hVPCI: integer = VPCISeries( #Close, 5, 20 );
var hSmoothed: integer = VMASeries( hVPCI, 20 );
SetSeriesFillColor2( hVPCI, 0, Pane1, 797, true );
SetSeriesFillColor2( hVPCI, 0, Pane1, 977, false );
PlotSeries( SubtractSeries( hVPCI, hSmoothed ), Pane1, #Gray, #ThickHist );
PlotSeriesLabel( hVPCI, Pane1, #Red, #Thin, 'VPCI(Close,5,20)' );
PlotSeriesLabel( hSmoothed, Pane1, #Black, #Thin, 'VMA(VPCI,20)' );
var Pane2: integer = CreatePane( 80, true, false );
var hMACD: integer = MACDSeries( #Close );
var hSignal: integer = EMASeries( hMACD, 9 );
SetSeriesFillColor2( hMACD, 0, Pane2, 797, true );
SetSeriesFillColor2( hMACD, 0, Pane2, 977, false );
PlotSeries( SubtractSeries( hMACD, hSignal ), Pane2, #Gray, #ThickHist );
PlotSeriesLabel( hMACD, Pane2, #Red, #Thin, 'MACD(Close,12,26)' );
PlotSeriesLabel( hSignal, Pane2, #Black, #Thin, 'EMA(MACD,9)' );
var Pane3: integer = CreatePane( 50, true, false );
var hADX: integer = ADXSeries( 7 );
DrawHorzLine( 30, Pane3, #Black, #Dotted );
SetSeriesFillColor2( hADX, 30, Pane3, #Silver, true );
PlotSeriesLabel( hADX, Pane3, #Red, #Thin, 'ADX(7)' );
--Giorgio Beltrame
www.wealth-lab.com
AMIBROKER: Volume Price Confirmation Iindicator (VPCI)
The article by Buff Dormeier in this issue, "Between Price And Volume," presents the volume price confirmation indicator (VPCI), which is an interesting indicator that combines price and volume action to produce reliable signals.
The coding for AmiBroker is straightforward and is shown here. Comments
inside the code make it self-explanatory. The formula can be used as an
indicator as well as a simple trading system. To use it, enter the code
in Formula Editor and choose Tools: Apply Indicator and/or Tools: Backtest
menu.
VCPI CODE
// volume weighted MA
function VWMA( array, period )
{
  return Sum( array * V, period ) / Sum( V, period );
}
// Volume Price Confirmation Indicator
function VPCI( speriod, Lperiod )
{
  Vw = VWMA( C, lperiod );
  Vpc = Vw - MA( C, lperiod );

  Vpr = VWMA( C, speriod ) / MA( C, speriod );
  Vm = MA( V, speriod ) / MA( V, Lperiod );
  return Vpc * Vpr * Vm;
}
// plot VPCI
speriod = Param("Short period", 5, 1, 50, 1 );
lperiod = Param("Long period", 20, 1, 100, 1 );
Vp = VPCI( speriod, Lperiod );
Plot( Vp, "VPCI"+ _PARAM_VALUES(), colorRed );
// and VPCI smoothed
aperiod = Param("Smoothing period", 20, 1, 30, 1 );
Vps = MA( Vp, aperiod);
Plot( Vps, "MA("+aperiod+")", colorBlue );
// simple trading system follows
Buy = Vp > Vps AND
      ADX( 7 ) > 10 AND
      MACD( 12, 26 ) > Signal( 12, 26, 9 );
Sell = Vps < Vp
A sample chart is shown in Figure 6.
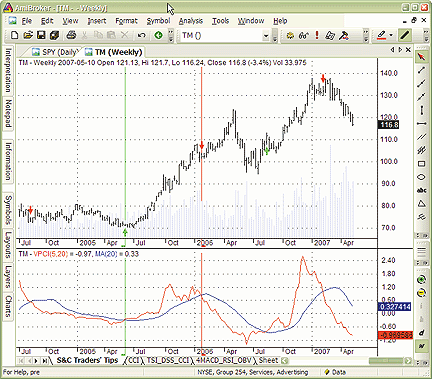
FIGURE 6: AMIBROKER, VPCI. This weekly chart of TM (upper pane) shows buy (green) and sell (red) raw signal arrows generated by crossovers of volume price confirmation indicator (5, 20) and its moving average (lower pane).
--Tomasz Janeczko, AmiBroker.com
www.amibroker.com
NEUROSHELL TRADER: Volume Price Confirmation Indicator (VPCI)
The volume price confirmation indicator (VPCI) described by Buff Dormeier
in his article in this issue can be easily implemented in NeuroShell Trader
by combining a few of NeuroShell Trader's 800+ indicators. To implement
the VPCI, select "New Indicator ..." from the Insert menu and use the Indicator
Wizard to create the following indicators:
VWMA:
VolWgtMovAvg ( Close, Volume, 50 )VPC:
Subtract (VolWgtMovAvg ( Close, Volume, 50 ), MovAvg ( Close, 50 ) )VPR:
Divide (VolWgtMovAvg ( Close, Volume, 10 ), MovAvg ( Close, 10 )VM:
Divide ( MovAvg (Volume, 10 ), MovAvg (Volume, 10 ) )VPCI:
Multiply3 ( VPC, VPR, VM )
A sample chart is shown in Figure 7. For more information on NeuroShell
Trader, visit www.NeuroShell.com.
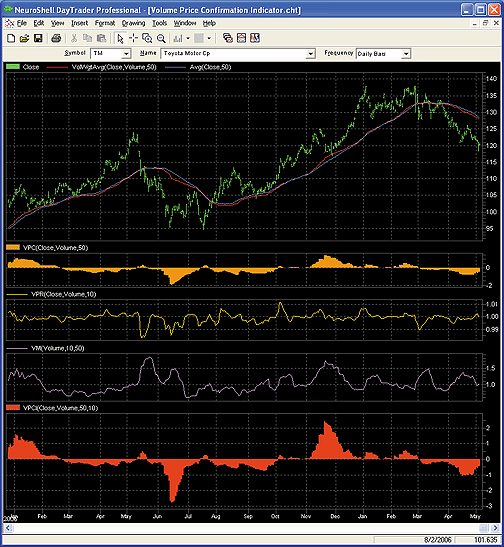
FIGURE 7: NEUROSHELL TRADER, VPCI CHART. Here is a sample NeuroShell chart demonstrating the volume price confirmation indicator.
--Marge Sherald, Ward Systems Group, Inc.
301 662-7950, sales@wardsystems.com
www.neuroshell.com
NEOTICKER: VOLUME PRICE CONFIRMATION INDICATOR (VPCI)
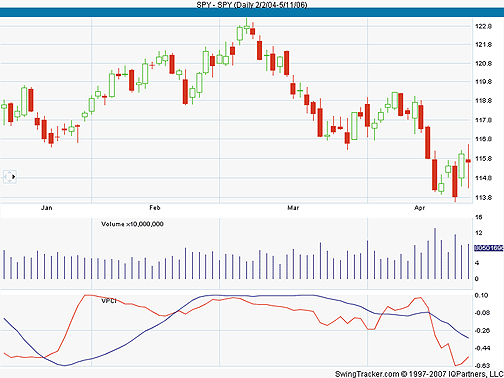
To implement the ideas shown in Buff Dormeier's article in this issue, "Between Price And Volume," first build the volume price confirmation indicator (VPCI) using NeoTicker's formula language. Next, compare VPCI signals with signals from the on-balance volume and moving average convergence/divergence, which we can do using a daily chart of SPY and three Backtest EZ power indicators.
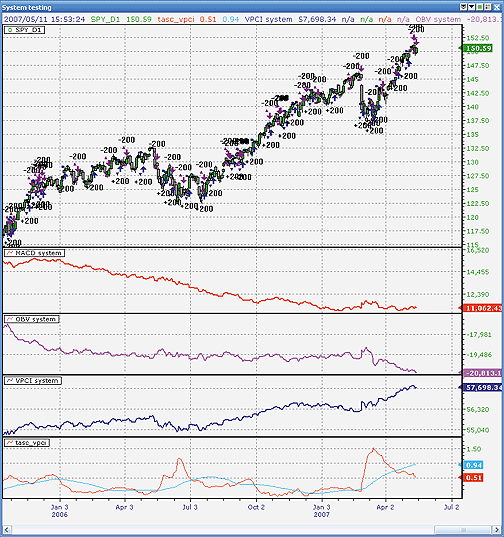
FIGURE 8: NEOTICKER, VOLUME PRICE CONFIRMATION INDICATOR VS. OBV/MACD SIGNALS ON SPY. Inspecting the Backtest EZ plot equity curve clearly shows which one is the more profitable signal.
The formula language for the volume price confirmation indicator
is shown in Listing 1. It has three integer parameters: long period (VPC),
short period (VPR), and smoothed period (that is, signal line smoothing).
Next, use the Backtest EZ power indicator to compare the quality of the VPCI, OBV, and MACD signals. First, make an SPY daily chart and then add a Backtest EZ indicator to the SPY data series. In the long entry and short entry formula fields, type in the VPCI long and short crossover signal formulas (Listing 2). Add two more Backtest EZ indicators for the OBV (Listing 3) and MACD (Listing 4). Inspecting the Backtest EZ plot equity curve (Figure 8) clearly shows which one is the more profitable signal. Use the performance viewer (Figure 9) to show the detailed statistics for each system.
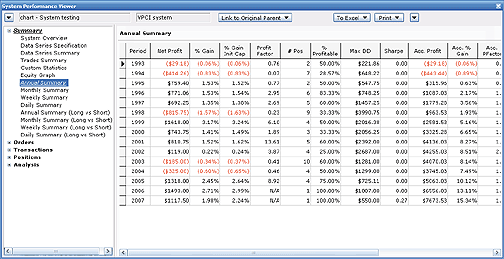
FIGURE 9: NEOTICKER, SYSTEM STATISTICS. Use NeoTicker's performance viewer to show the detailed statistics for each system.
A downloadable version of this indicator will be available from
the NeoTicker blog (https://blog.neoticker.com).
NEOTICKER LISTING 1
$VPC := average(data1, param1)-vaverage(data1, param1);
$VPR := vaverage(data1, param2)/average(data1, param2);
$VM  := average(v, param2)/average(v, param1);
plot1 := $VPC*$VPR*$VM;
plot2 := average(plot1, param3);
NEOTICKER LISTING 2
Long Entry: xabove (tasc_vpci.plot1 (data1, 50, 10, 50),
tasc_vpci.plot2 (data1, 50, 10, 50)) > 0 and
adx(data1, 7) > 30
Short Entry: xbelow (tasc_vpci.plot1 (data1, 50, 10, 50),
tasc_vpci.plot2 (data1, 50, 10, 50)) > 0 and
adx(data1, 7) > 30
NEOTICKER LISTING 3
Long Entry: xabove (obv(data1),
                    average (obv(data1), 8)) > 0 and
                    adx(data1, 7) > 30
Short Entry: xbelow (obv (data1),
                    average (obv(data1), 8)) > 0 and
                    adx(data1, 7) > 30
NEOTICKER LISTING 4
Long Entry: xabove (qc_MACD(0,data1,12,26,"Yes",9),
                    qc_MACD.plot2(0,data1,12,26,"Yes",9))
Short Entry: xbelow (qc_MACD(0,data1,12,26,"Yes",9),
                    qc_MACD.plot2(0,data1,12,26,"Yes",9))
--Kenneth Yuen, TickQuest Inc.
www.tickquest.com
WORDEN'S MODULAR TOOLS: Volume Price Confirmation Indicator (VPCI)
Note: To run the tool described here, you will need the free Blocks Player from The Blocks Company. You can download the Blocks Player at www.blocks.com/player.
For the article by Buff Dormeier in this issue, "Between Price And Volume," we've created a Modular Chart Tool that runs in the Blocks Player. To run it, open the Personal Chartist workspace in the Blocks Player and click the Start button. Click the Web Library tab, then double-click on the Worden folder. Double-click the S&C Traders Tips folder and double-click on the volume price confirmation indicator.
The tool contains a price graph in the top pane with a simple price moving average (SMA) and a simple volume- weighted price moving average (VWMA). Volume bars are plotted in the second pane to illustrate areas where the VWMA moves away from the SMA as volume increases (points A and B). The volume price confirmation indicator (VPCI) is plotted in the bottom pane along with a volume-weighted moving average named VPCI Smoothed" (Figure 10).
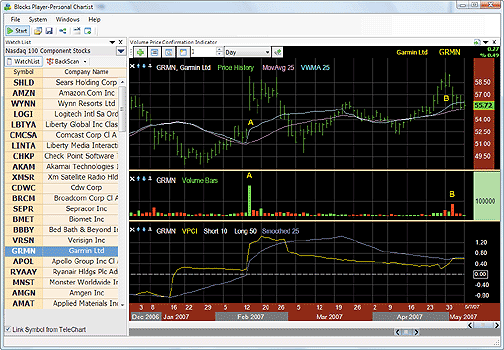
FIGURE 10: WORDEN, VPCI. The top pane shows a simple price moving average (SMA) and a simple volume weighted price moving average (VWMA). Volume bars are plotted in the second pane to illustrate areas where the VWMA moves away from the SMA as volume increases (points A and B). The volume price confirmation indicator (VPCI) is plotted in the bottom pane along with a volume-weighted moving average, VPCI smoothed.
You can change the short and long periods used in the VPCI calculation
by clicking on short and long in the legend to the right of VPCI.
No code or cutting & pasting is required to use this tool. To see
how the components of VPCI are calculated, right-click in the VPCI pane,
then click on Patch Panels, then click on the component you want to view.
The components are:
Vpc: Volume-price confirmation/contradiction
Vpr: Volume-price ratio
VM: Volume multiplier
This will open its block diagram, so you can review (and edit) its
logic.
The volume weighting in the moving averages is accomplished by dividing the moving average of price*volume by the moving average of volume.
VPCI can also be added to an existing chart in the Personal Chartist workspace by clicking the Add Study button and clicking on the S&C Traders' Tips folder.
To discuss this Tool, please visit the Discussion Forum at Tools.Worden.com. Online trainers will be happy to assist you.
--Patrick Argo and Bruce Loebrich
Worden Brothers, Inc.
800 776-4940, www.worden.com
TRADECISION: Volume Price Confirmation Indicator (VPCI)
In his article, "Between Price And Volume," Buff Dormeier has demonstrated that adding the volume price confirmation indicator (VPCI) to your arsenal of trading techniques resulted in improved trading performance.
Tradecision's Function Builder enables you to recreate the VPCI function:
function
(LongPeriod:numeric=50,ShortPeriod:numeric=10):Numeric;
 var
   sv:=VWMA(C,ShortPeriod);
   ss:=SMA(C,ShortPeriod);
   sva:=SMA(V,ShortPeriod);
   lva:=SMA(V,LongPeriod);
   VPC:=sv-ss;
   VPR:=sv/ss;
   VM:=sva/lva;
 end_var
return VPC * VPR * VM;
To recreate the Vpci strategy, use the Strategy Builder:
Entry long:
return CrossAbove( VPCI(50,10),SMA(VPCI(50,10),10) );
Entry short:
return CrossBelow( VPCI(50,10),SMA(VPCI(50,10),10) );
A sample chart is in Figure 11. To use the VPCI function and strategy
in Tradecision, visit the area "Traders' Tips from TASC magazine" at https://tradecision.com/support/tasc_tips/tasc_traders_tips.htm
or copy the code from the STOCKS & COMMODITIES website at www.Traders.com.
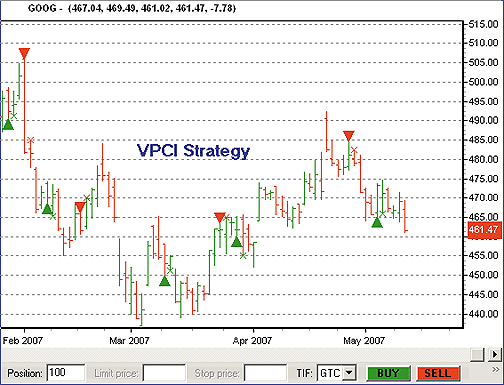
FIGURE 11: TRADECISION. Here you see an example of the VPCI strategy applied to a Google daily chart.
--Alex Grechanowski
Alyuda Research, Inc.
sales@alyuda.com, 510 931-7808
www.alyuda.com, www.tradecision.com
STRATASEARCH: VOLUME PRICE CONFIRMATION INDICATOR (VPCI)
The use of volume to confirm price movement is a very good one, and Buff Dormeier has done an excellent job of providing us with a new indicator to take advantage of this. In fact, it is quite rare that we see an indicator so unique added to the large population of indicators already available.
In our testing of the VPCI, we used both a moving average crossover as well as a zero-line crossover (Figure 12). Both performed surprisingly well without the use of additional indicators. However, as mentioned in the article, the use of supporting indicators can be a great benefit in narrowing down the ideal situations and times in which the Vpci truly excels.
FIGURE 12: STRATASEARCH, VCPI COMPARISON WITH OTHER INDICATORS. While there are similarities between the VCPI and other indicators, the comparison makes it easy to see their differences.
StrataSearch users can easily add the VPCI to an automated search,
testing this indicator's performance alongside thousands of other indicators.
As usual, a plug-in containing all the necessary code can be found in the
Shared Area of our user forum. This month's plug-in contains the custom
formulas, a strategy, chart, and multiple trading rule setups that allow
the VPCI to be investigated as both a primary or supporting indicator in
a fully automated search.
//****************************************************************
// Volume Weighted Moving Average
//****************************************************************
value = parameter("Value");
days = parameter("Days");
total_volume = sum(volume, days);
temp = 0;
x = 0;
while(x < days) {
    temp += (ref(value, -x) * (ref(volume, -x) / total_volume));
    x+=1;
};
VWMA = temp;
//****************************************************************
// Volume Price Confirmation Indicator
//****************************************************************
value = parameter("Value");
short_days = parameter("ShortDays");
long_days = parameter("LongDays");
VPC = VWMA(value, long_days) - mov(value, long_days, simple);
VPR = VWMA(value, short_days) / mov(value, short_days, simple);
VM = mov(volume, short_days, simple) / mov(volume, long_days, simple);
VPCI = VPC * VPR * VM;
--Pete Rast
Avarin Systems, Inc.
www.StrataSearch.com
AIQ: VOLUME PRICE CONFIRMATION INDICATOR (VPCI)
The AIQ code is given here for the VPCI and related indicators presented in Buff Dormeier's article in this issue, "Between Price And Volume." This code can be used to develop trading systems, or the indicator can be used as a filter for existing systems. Due to a short publishing deadline, I was unable to run system tests. I tried different plotted indicator displays and decided that two smoothed VPCI indicators plotted as a histogram, which shows the difference between the two smoothed indicators, would give the most useful display.
The indicator plot shown in Figure 13 uses parameters of 50 and 10 days to compute the VPCI, then takes two simple averages of this VPCI using 5 and 10 days. The difference between these two smoothed indicators is then plotted as a histogram.
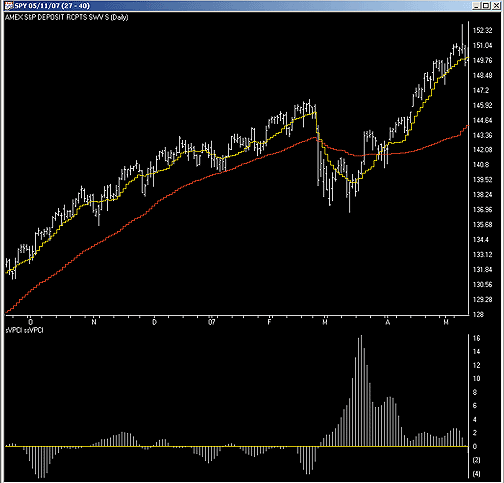
FIGURE 13: AIQ, SMOOTHED VPCI HISTOGRAM. Here, SPY is shown with a 50-day VWMA (red), 10-day VWMA (yellow), and sVPCI, ssVPCI (50,10,5,10) histogram (lower indictor plot in white).
The code can be downloaded from the AIQ website at www.aiqsystems.com
and also from www.tradersedge systems.com/traderstips.htm. It can also
be copied and pasted from the STOCKS & COMMMODITIES website at Traders.com.
!! CONNECTION & AFFINITY BETWEEN PRICE & VOLUME
! Author: Buff Dormeier, TASC July 2007
! Coded by: Richard Denning 5/11/07
! PARAMETERS
Price     is [close].
LT    is 50.
ST    is 10.
S    is 5.
SS    is 10.
! SIMPLE MOVING AVERAGE OF PRICE (SMA)
SMA_L     is sum(Price,LT) / LT.
SMA_S    is sum(Price,ST) / ST.
V    is [volume].
! VOLUME-WEIGHTED MOVING AVERAGE (VWMA)
VTOT_L     is sum(V,LT).
VWMA_L    is sum(Price * (V / ^VTOT_L),LT).
VTOT_S    is sum(V,ST).
VWMA_S     is sum(Price * (V / ^VTOT_S),ST).
! VOLUME-PRICE CONTRADICITION/CONFIRMATION (VPC + / - )
VPC    is VWMA_L - SMA_L.
! VOLUME PRICE RATIO (VPR)
VPR     is  VWMA_S / SMA_S.
! VOLUME MULTIPLIER (VM)
VMA_S    is sum(V,ST) / ST.
VMA_L    is sum(V,LT) / LT.
VM    is VMA_S / VMA_L.
! VOLUME-PRICE CONFIRMATION INDICATOR (VPCI)
VPCI    is VPC * VPR * VM.
! SMOOTHED VOLUME-PRICE CONFIRMATION INDICATOR(sVPCI)
sVPCI    is sum(VPCI,S) / S.
ssVPCI    is sum(VPCI,SS) / SS.
! INDICATOR FOR HISTORIGRAM PLOTTING.
dsVPCIss is sVPCI - ssVPCI.
--Richard Denning
AIQ Systems
richard.denning@earthlink.net
NINJATRADER: Volume Price Confirmation Indicator (VPCI)
The volume price confirmation indicator discussed in Buff Dormeier's article in this issue, "Between Price And Volume," can be reconstructed easily using the NinjaScript Indicator Wizard.
FIGURE 14: NINJATRADER, VPCI. This sample NinjaTrader chart shows the volume price confirmation indicator (blue line) plotted in the same panel as the standard on-balance volume (red line) indicator.
From within the NinjaTrader Control Center window, select the menu
Tools > New > NinjaScript.
1. Within the wizard, press the "Next" button.
2. Add "VolumePriceConfirmation" for the name field and any additional descriptive information, then press the "Next" button.
3. Add an input parameter "LongTerm," and set the default value to 50. Add a second input parameter, "ShortTerm," set the default value to 20, and press "Next."
4. Add the plot name, "Vpci," set the color of the plot, and press "Next."
5. Add a line "ZeroLine," set the color of the line, and press the "Generate" button.
By pressing "Generate," the wizard will launch the NinjaScript Editor
and automatically create the indicator code for you. Within the editor,
replace the code contained within the OnBarUpdate() method with the following
code:
double vpc = VWMA(LongTerm)[0] - SMA(LongTerm)[0];
double vpr = (VWMA(ShortTerm)[0] / MA(ShortTerm)[0]);
double vm  = SMA(Volume, ShortTerm)[0] / SMA(Volume, LongTerm)[0];
VPCI.Set(vpc * vpr * vm);
6. Within the editor, press F5 to compile the indicator.
7. You have now created your Vpci indicator.
NinjaScript indicators are compiled DLLs that run native, not interpreted, which provides you with the highest performance possible. You can download images that correspond to the wizard steps above and the indicator source code from www.ninjatrader.com/SC/Vpci.zip.
--Raymond Deux, NinjaTrader, LLC
www.ninjatrader.com
TRADINGSOLUTIONS: VOLUME PRICE CONFIRMATION INDICATOR (VPCI)
In "Between Price And Volume," Buff Dormeier introduces the volume price confirmation indicator (VPCI).
This function can be entered into TradingSolutions as described below.
It is also available as a function file that can be downloaded from the
TradingSolutions website (www.tradingsolutions.com) in the Solution Library
section. As with many indicators, these functions could make good inputs
to neural network predictions.