Powerful Or Picayune?
Premarket Prediction
Can premarket activity be a powerful predictor as to how underlying stocks will perform during regular market hours? Will this knowledge be advantageous to traders?
Premarket activity refers to stocks that undergo active trading before the US market opens -- that is, before 9:30 ET. This activity may be caused by earning announcements from either before the market opens or after yesterday's close, upgrading or downgrading by analysts, or other news that may influence the stocks' movement. After analyzing about a half-year's data, we are beginning to uncover the connections between premarket activity and stock trends during regular trading hours.
DATA COLLECTION
The first step in the analysis is data collection. The premarket data was collected from the NASDAQ website from February 1, 2006, to July 31, 2006. We wrote a program that fetched the data from the website every morning around 9:25 ET. This data includes the current price before the market opens, yesterday's closing price, and the premarket trading volume. Using this data, we were able to calculate the percentage change of the current price relative to yesterday's close, referred to as percent change. We will discuss the effects of these data on the underlying stocks' movements during regular trading hours. Trading activity involves entering a position at the open price and exiting the position at the close of the day; therefore, this is a daytrading system. For short positions, we are limited to stocks with a price above $6.
PRICE RANGE EFFECT
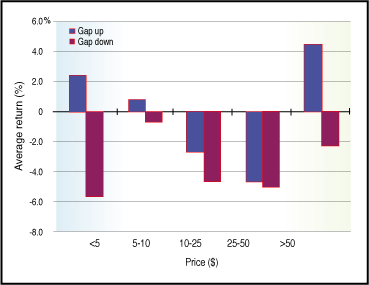
The effect of the price range on the average percentage return for long positions is illustrated in Figure 1. In this figure, we set premarket volumes to those above 10,000 and the percent change to those greater than or equal to 20%. Gap up stocks with a higher price range -- that is, prices equal to or above $50 -- tend to have a positive average percentage return of 4.46%.
However, due to the small number of data applicable to this range, these observations may not be statistically reliable. Stocks that range from $10 to $25 and $25 to $50, on the other hand, perform poorly in long positions. The average return for stocks between $10 and $25 is -2.74% with winning odds of 22.2%, while stocks priced between $25 and $50 have an average return of -4.65% with all trades being losses.
Based on this observation, it would be advisable to short gap-up stocks priced in this range. For prices between $5 and $10, there is an average return of 0.79%, with winning odds of 41.7%. Stocks priced less than $5, or penny stocks, have more volatile trading patterns. A few have large positive returns, but most of them lose money in long positions. Overall, there is a 2.46% average return with 33.3% winning odds for this price range.

FIGURE 1: EFFECT OF PRICE RANGE ON AVERAGE PERCENTAGE RETURN. Blue bars indicate gap-up stocks in long positions. Maroon bars indicate gap-down stocks in long positions. Premarket volume and percent change are held constant at greater than or equal to 10K and greater than or equal to 20%, respectively, with an exception for gap-down positions above $50, which have volumes greater than or equal to 10k and percent changes greater than or equal to 10%.
...Continued in the July issue of Technical Analysis of STOCKS
& COMMODITIES