Using Trendlines For Trading
Trading Trendline Breaks
One of the best trading methods in technical analysis is the application of trendline breaks. Find out why.
I am convinced that one of the best trading methods using technical analysis is the application of trendline breaks. Let me convince you too. Let's start off by discussing the differences and similarities of linear and logarithmic scaling. First of all, take a look at your charts. Are they linear both horizontally for the time setting and vertically for the price setting? Or do you have to use a semilogarithmic scale with a linear scaling on the time axis and a logarithmic scaling on the price axis?
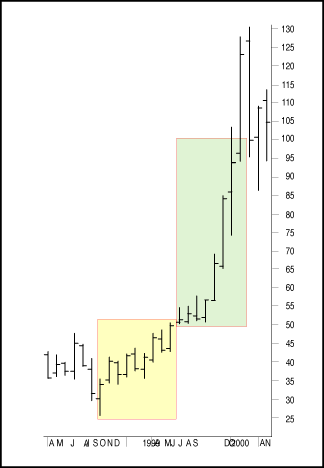
Linear scaling: If you are using a division of five points on the linear scaling, then for a price change from $25 to $50 there are five divisions. For a price change from $50 to $100 there are 10 divisions. This means that the distance on the vertical axis from $50 to $100 is twice as large as the one from $25 to $50 (Figure 1).

FIGURE 1: LINEAR SCALING. When using a linear scaled chart, the price move between $25 to $50 is five units and from $50 to $100 is 50 units. However, the percent change between the two moves is the same.
On the other hand, a price change from $25 to $50 or from $50 to $100 both equal a 100% price increase. A price moving from $5 to $10 or from $100 to $105 is the same distance on a linear scale. It is clear that this does not give a good visual impression of what the price movement really represents. Moving from $5 to $10 is a 100% price increase, but from $100 to $105 is only a 5% increase.
...Continued in the July issue of Technical Analysis of STOCKS &
COMMODITIES
STOCKS & COMMODITIES magazine. All rights reserved. © Copyright 2007, Technical Analysis, Inc.
Return to July 2007 Contents