Revising Something Old For Something New
How Effective Are Rectangles?
It's one of the oldest patterns in technical analysis, but how reliable is it? By statistically evaluating the performance of rectangle formations, we can derive a new formula that can remove the guesswork from estimating the price target.
After having traded rectangle formations for some time, I discovered the traditional measuring formula to be too conservative and its use almost always resulted in premature exits. Technical literature about these formations provides only a minimum price objective but not an average or most likely target. The classical method used for measuring these reliable and profitable formations is simple and straightforward, but how accurate and reliable is it? Given the limited amount of statistical studies on the subject, I decided to investigate.
For the purpose of this study I found 100 rectangle formations for the preceding two-year 2004-05 period. My criterion for including a pattern in the list was a sideways price action bounded by two horizontal or nearly horizontal support & resistance lines. I then made note of the price level of the support & resistance lines, the rectangle duration, slope and volume trend, the price at the breakout above the upper rectangle boundary, and the first short-term top.
Other interesting statistics I noted were the volume on the breakout day, the duration, magnitude, and timing of any throwbacks following the initial breakout, and also the direction of any premature or false breakouts.
Statistical analysis of the results revealed some surprising findings contradicting some widely accepted principles.
FORMATION CHARACTERISTICS
A rectangle formation is simply the result of supply and demand equilibrium between evenly matched buyers and sellers. The sellers want to liquidate their position at a certain high price and the buyers want to accumulate the stock at a lower price. A breakout from the rectangle indicates that one group has exhausted itself and a winner has emerged. This is sometimes triggered by an event or news. Some indicators such as money flow can provide clues to the direction of the breakout, but nothing will be certain until the price breaks out of the boundaries.
Rectangles consist of a sideways price action or congestion area bounded by two horizontal or nearly horizontal parallel trendlines along the top and bottom. At least two points are required to define each line, but three points are more common. Three or more points define the upper and lower horizontal boundary lines for two-thirds or 65% of the rectangles in my sample.
Rectangles can be either continuation or reversal patterns; it depends
on the direction of the breakout in relation to the price trend prior to
prices entering the formation. As reversals, rectangles appear more commonly
at bottoms. My research suggests that they are more often continuation
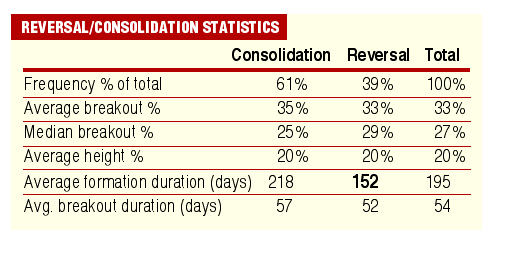
rather than reversal formations with a ratio of approximately 1.5:1 (61%
continuations to 39% reversals). An interesting statistic in Figure 1 notes
that reversals tend to take a shorter time to complete than continuation
patterns.

FIGURE 1: RECTANGLES ARE MORE OFTEN CONTINUATION RATHER THAN REVERSAL FORMATIONS. Note that reversals have a significantly shorter average duration (152 days or five months) compared to 218 days or seven months for the corresponding continuation formations.
...Continued in the June issue of Technical Analysis of STOCKS
& COMMODITIES
Excerpted from an article originally published in the June 2007 issue
of Technical Analysis of
STOCKS & COMMODITIES magazine. All rights reserved. © Copyright
2007, Technical Analysis, Inc.
Return to June 2007 Contents