Lower The Lag, Up The Trading
Moving Average Crossovers
In the first part, we examined how to overcome the lagging tendency of the moving average crossover. Here in part II, we look at trading opportunities presented by decreasing the lag of a moving average crossover.
IN the first part of this series, I applied the 20-day and 30-day simple moving average (SMA) on the stocks in the NASDAQ 100 index. This time, I will use the same 100 stocks and look at them from a different perspective. I will calculate the number of moving average crossover predictions and the number of actual crossovers and plot them as daily functions. In Amibroker this can be done with the help of the AddToComposite() function. Now, let us create the new artificial tickers for the entire database of 100 stocks:
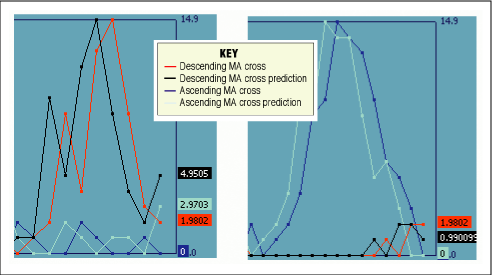
"~DescPR," the number of stocks with a Descending MAcross Prediction [black line]"~Dcr," the number of stocks with a confirmed Descending MAcross [red line]"~AcrPR," the number of stocks with an Ascending MAcross Prediction [light blue line]"~Acr," the number of stocks with a confirmed Ascending MAcross [dark blue line]
In Figure 1 you can see that the prediction lines anticipate the actual line crosses by one day. To create these tickers I used the Amibroker Formula Language (AFL) code found in the Composite Tickers sidebar. Then I plotted the chart using the code found in "The population of cross predictions vs. the actual crosses" sidebar (see page 28).

FIGURE 1: MARKET BEHAVIOR. Here you can see that the prediction lines anticipate the actual line crosses by one day.
In my market analysis I did not look at individual stocks; I counted all descending cross predictions as one and added them to come up with the final number. It is obvious from Figure 1 that the individual anticipation property is also a market property. The predictions anticipate the actual crosses by one day.
...Continued in the March issue of Technical Analysis of STOCKS &
COMMODITIES
Excerpted from an article originally published in the March 2007 issue of Technical Analysis of
STOCKS & COMMODITIES magazine. All rights reserved. © Copyright 2007, Technical Analysis, Inc.
Return to March 2007 Contents