Using The Fractal Dimension Index
Trading Systems And Fractals
In the second part of this series, we look at the application of fractals to a few well-known trading systems.
There have been many applications of fractal methods to trading, the most popular of which has been an indicator based on the fractal dimension of a time series. The fractal dimension index (FDI) can be used as a filter to identify trending compared with trading range markets. Other indicators, like fractal--based adaptive moving averages, have also been proposed. The idea behind such moving averages is to adapt to the randomness of a price series. If the price is more random (trading in a range) as indicated by the fractal dimension value, the moving average is slower, leading to fewer whipsaws. In a less random market (trending), however, the moving average is faster, leading to prompt entries and exits.
APPLYING THE FDI
In this article, we focus on the FDI and its application to trading
systems. The FDI measures the fractal dimension of a price series. Its
value ranges between 1 and 2. A value less than 1.5 (a Hurst exponent greater
than 0.5) indicates that the price series is persistent, or that the market
is trending. On the other hand, a value greater than 1.5 indicates the
series is antipersistent or that the market is trading in a range. Figure
1 shows the FDI for IBM for the period 1997--99. The FDI lies mainly
above 1.5 when the prices are in a trading range (for example, between
September 1997 and April 1998) and falls below 1.5 when prices are trending
(for example, between October 1998 and February 1999).
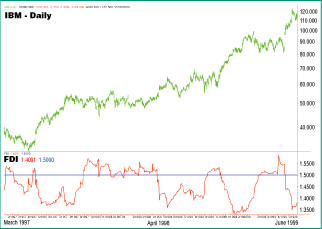
FIGURE 1: FDI INDICATOR. Here you see the chart of IBM from March 1997 to June 1999 with the FDI applied to it.
To test the usefulness of the FDI as a filter for trade selection, we
applied it to three simple and popular trading systems. The objective of
these tests was to demonstrate the benefit added by filtering trades with
the FDI, not intended to demonstrate the reliability or profitability of
the underlying systems. We chose a representative universe of the 50 most
liquid US stocks, for the January 2000 to December 2005 period, and did
not optimize system parameters or exit techniques.
...Continued in the March issue of Technical Analysis of STOCKS &
COMMODITIES
Excerpted from an article originally published in the March 2007
issue of Technical Analysis of
STOCKS & COMMODITIES magazine. All rights reserved. © Copyright
2007, Technical Analysis, Inc.
Return to March 2007 Contents