It Ain't The Beat, It's The Motion
From Nile To NYSE
By Radha Panini
Here's an analysis of the profitability of an indicator based on the Hurst exponent.
IN researching and developing trading systems, we came across an indicator based on fractal concepts. Not only is it simple and functional, the underlying theory is elegant and introduces a new way of looking at finance. To understand it better we looked into the origins of fractal concepts in finance. Here, we begin with the historical development of the field and follow it with the underlying theory and numerical methods. Then we test the utility of a trend indicator, the fractal dimension index, based on the fractal dimension. We found that this indicator is a reliable way of improving results for any trend-sensitive system.
FRACTALS IN FINANCE
Finance theory has been deeply anchored in a model of asset price movement following a Gaussian distribution (see sidebar "Gaussian distribution"). The theory's foundations lay in Louis Bachelier's 1900 dissertation "Theory of Speculation." Bachelier proposed that the movement of stock prices in the Paris Bourse can be modeled as a Brownian motion, which is a mathematical model that describes the random motion of pollen particles suspended in water. This model, however, had a shortcoming in that it allowed for the possibility of negative asset prices.
To ensure that prices take on only positive values, Paul Samuelson proposed the geometric Brownian motion model under which the change in the logarithm of prices (price returns) are normally distributed (see sidebar "Models of stock price behavior"). These assumptions were accepted for their elegance and simplicity and led to the development of finance theories such as the efficient market hypothesis, the Black-Scholes theory for option pricing, and the capital asset pricing model (CAPM) for portfolio risk.
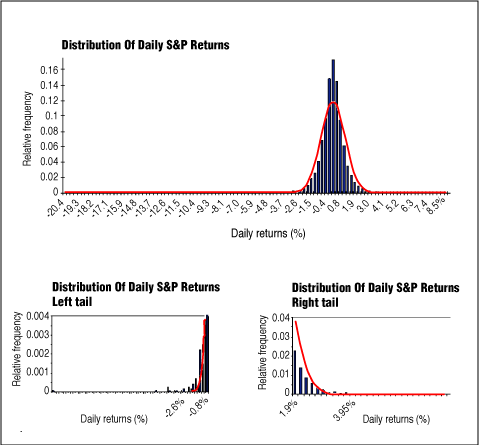
Benoit Mandelbrot was the first to challenge this model for asset price behavior. While studying the price of cotton at different exchanges in the US, he noticed that the distribution of returns could not be fully described by the Gaussian model. There were two problems with the existing model. The first was that the actual distribution of returns had "fatter" tails (see Figure 1). This meant that the likelihood of large movements in stock prices was much higher than that predicted by the Gaussian distribution. According to the Gaussian model, the likelihood of an event like the crash of 1987 happening was less than one in 1050. Yet such events do happen, and over the course of history, we have seen that they happen more often than predicted by the Gaussian model.

FIGURE 1: FAT TAILS OF S&P RETURNS (1960-2004). On the top graph you see the frequency distribution of S&P returns. The red curve represents the normal distribution. On the charts below you see the left and right extremes of the graph. The distribution at the tail is fatter than that of the normal distribution curve.
...Continued in the February issue of Technical Analysis of STOCKS & COMMODITIES
Excerpted from an article originally published in the February 2007
issue of Technical Analysis of
STOCKS & COMMODITIES magazine. All rights reserved. © Copyright
2007, Technical Analysis, Inc.
Return to February 2007 Contents