January 2007 Letters To The Editor
The editors of S&C invite readers to submit their opinions and information on subjects relating to technical analysis and this magazine. This column is our means of communication with our readers. Is there something you would like to know more (or less) about? Tell us about it. Without a source of new ideas and subjects coming from our readers, this magazine would not exist.
Address your correspondence to: Editor, STOCKS & COMMODITIES, 4757 California Ave. SW, Seattle, WA 98116-4499, or E-mail to editor@traders.com. All letters become the property of Technical Analysis, Inc. Letter-writers must include their full name and address for verification. Letters may be edited for length or clarity. The opinions expressed in this column do not necessarily represent those of the magazine. -Editor
THE SCIENTIFIC WORK OF LUNA B. LEOPOLD
Editor,
Curious readers may be interested in the article "Up A Lazy River" by Brian Hayes in the November/December 2006 issue of American Scientist magazine. A brief, but more accessible, article can be found at https://bit-player.org/2006/old-man-river. Both are a tribute to the work of Luna B. Leopold, who died earlier this year. In a 1966 article, Mr. Leopold gave a lucid account of how river meanders form and why they assume their sinuous shapes.
Mr. Leopold never knew I existed, but he had a huge impact on my view of the market. His accounts are consistent with the solution of the Drunkard's Walk problem and, taken together, made it clear to me how the market could be both random and short-term coherent. I could never carry the solution beyond the philosophical level because both the Telegrapher's Equation and the river meanders are boundary-value problems. It is probably impossible to demonstrate boundary values in market data (but it is impossible to prove impossibility). In any event, it was Mr. Leopold's description of river meanders that sent me on my decades-long quest to extract short-term coherent signals from price information.
So I would like to add my tribute to Luna Leopold. We never know how our work may influence others.
John Ehlers
BEYOND SETUPS
Editor,
I have been a long-term subscriber to S&C and this is the first time I have written to you. I would just like to comment on Steve Palmquist's article "Beyond Setups" in the November 2006 issue. As I was reading and digesting his article, it was almost as if Palmquist was writing about me to me. His article was easily understandable and made a lot of sense. As a result, I will be looking at his Timely Trades Letter to see if I can work him and his system into my "toolbox."
Andy Ermenc
R ALGORITHM
Editor,
Early this year, I discovered the R algorithm. It works very well and allows great flexibility in choosing your level of risk compared with desired gain levels. Here is the algorithm:
A 66-day chart is used; two simple probability assessments are made of R being equal to or greater than the desired gain on a given day, and of R being less than 1.0. I taught this method on a major forum in March and many traders are using it with success. A visual example can be seen at https://whattolearn.com/sampleofr.gif. It does require some basic spreadsheet skills.R= Current Hod / Previous day's Lodwhere: Hod = high of day and Lod = low of day.
Second, I'm a quant trader and I offer a quantitative training module (as a Pdf file and also on video). Would you be interested in reviewing it?
Thank you for considering this.
Dennis Hudson
Thank you for sharing this information with us. You are welcome to submit articles on the subject, or submit products for possible review, to editor@traders.com.-Editor
INFORMATION NEEDED
Editor,
I'm looking for historical data on the Xau, Hui, Gdm indexes and spot closing prices of gold and silver since 2000. Can you help me obtain that info?
Marko379
You might try the following:
https://commodities.thefinancials.com/
The World Gold Council:
https://www.gold.org/value/stats/statistics/index.html
CBOT Data Exchange:
https://www.cbot.com/cbot/pub/cont_detail/
0,3206,1033+42623,00.html
Hope this helps.-Editor
WORKING MONEY ARTICLES
Editor,
I would appreciate knowing whether I can download a single article appearing online in Working-Money.com. The title is "Accumulation And Distribution" by David Penn published on August 15, 2006. At this time, I am not prepared to subscribe or go through a trial subscription, which I would then have to cancel. Your assistance is kindly appreciated.
Martin Pepus
Working Money articles are not available for individual purchase through
our Online Store at www. Traders.com, since Working Money articles are
for subscribers to Working-Money.com, with a selection of them reprinted
in this magazine and also in our Traders.com bimonthly printed publication.
As it happens, the article "Accumulation And Distribution" was
reprinted in the November/December 2006 issue of our Traders.com printed
publication, and you can purchase that issue for $7 by calling our Circulation
Department at 800-Technical.-Editor
FUTURES LIQUIDITY MONTHLY TABLE
Editor,
As always, the November 2006 issue of Stocks & Commodities is packed full of profitable reading - you folks really know how to produce a great magazine.
I have a question: On page 89 of that issue, in the Futures Liquidity section, a footnote interprets "Contracts to trade equal dollar profit" as how many contracts of one commodity must be traded to equal that of another commodity. But there is no reference point to what "other" commodity this figure is being related to. For example, take the Libor one-month contract. The "Contracts to trade - Profit" records this commodity as 1 and "Wheat - soft red" as 43. Does this mean that 43 contracts of red wheat must be traded to equal the profit (given the same percentage move) of one Libor? In other words, what is the reference point to establish these figures?
I have often asked my broker if there are any particular commodities that would produce greater leverage (or profits/losses given the same percentage move). His answer has invariably been no, that they have been designed so that the margin requirements versus the size of contract are equal. Unless I am misunderstanding the meaning of this chart and footnote, I can see that some may be "more equal" than others.
Thanks very much for taking the time to answer this question and keep up the great work.
PS: Is this subject worth exploring further and, if so, where can I locate additional information on a more complete explanation of each column in this chart?
Bob Pattison
Publisher Jack K. Hutson replies:
We only want to trade futures contracts that are liquid all of the time. A liquid futures contract has much less chance of trapping us on the wrong side of a limit price move, and order fills should be faster and closer to our expected price.
Futures contract liquidity requires a combination of volume (mostly day trading), open interest (overnight holders), and price movement (profit opportunity). A futures contract past price movement (three-year maximum price excursion) is what our Futures Liquidity table uses to gauge how far today's price has moved from past highs or lows. For example, if the highest a contract has reached is 100 and the lowest is 60, and today's price is 70, then the maximum price excursion is 30. We can reasonably expect the price of this contract to have another 30-point excursion sometime in the future.
The "Contracts to trade equal dollar profit" column in our Futures Liquidity table shows the number of futures contracts that would have been required to produce the same profit during the most recent three-year maximum price excursion lookback period. Futures contracts vary in size and cannot be directly compared with each other. This column represents a rough way of gauging futures contract sizes.
Minimum margin requirements are set and modified by the exchanges, but individual brokerages sometimes require more margin. Exchange minimum margins are designed to force exchange members not to get overexposed to market movements. Margin requirements are not uniform or always logical and timely.
The "% Margin" column shown in our Futures Liquidity table is the percentage margin required to control the underlying deliverable contracted asset. "Effective % Margin" is again based on a three-year lookback, a more realistic relative number. With futures, we are just trading the change in prices.
The Futures Liquidity table is meant to answer a few simple questions, for which the answers are not always obvious, such as:
1. Can you usually get in and out of a position?
2. How relatively big is a contract?
3. How much leverage will our margin produce?
Hope this helps.
INTERNATIONAL TRADES
Editor,
On page 71 of your October 2006 issue in the Trading Liquidity: Futures section, I saw "% Margin" and "Effective % Margin." I don't know what the difference is between the two terms. Can someone hedge currencies when they are doing international trades?
Emmet McDonagh
Publisher Jack K. Hutson replies:
As for an explanation of our Futures Liquidity table (page 89 in this issue), see the previous question and answer.
Your second question is much more difficult to answer. Yes, but...
When trading foreign instruments, such as stocks, mutual funds, or exchange traded funds (ETF), you are also trading the US dollar. Foreign instruments have been doing very well during the past few years, in large part because of the devaluation of the US dollar.
In theory, hedging foreign currencies is easy by using futures or forex markets. In application, it takes a great deal of time and effort. Mentally, trading a (hopefully) longer-term foreign stock or fund while hedging the currency against adverse short-term US dollar price changes is difficult. In practice, it may only be worth the effort when the trader is trying to hold on to qualify for long-term capital gains tax treatment. Most of the time, trading in and out of foreign stocks should be done in comparison to all of the trader's investments.
ERRATA: HARNESSING THE (MIS) BEHAVIOR OF MARKETS
Editor,
In the June 2006 issue is an article by Rick Martinelli, "Harnessing The (Mis)Behavior of Markets," in which the author describes a trading system intended to profit from extraordinary price changes.
Putting aside any comments on the approach taken by Martinelli, I would like to point out some mathematical errors and incongruities that deserve some observations.
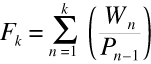
On page 22, Rick Martinelli writes, "...an investment of D dollars on day zero results in a profit/loss of D*Fk on day k." According to Martinelli, Fk, the fortune indicator, is calculated by adding consecutive fractional changes from day zero to day k:
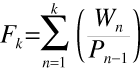
However, one cannot reconstruct a price variation by adding fractional changes! Addition must be replaced with multiplication, and the formulas should be:
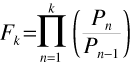
with a profit/loss of D(Fk - 1)
For example, if we consider the price series (10, 11, 12, 13), Martinelli's investment of $1,000 on day zero equates to a profit of $274 on day 3, when everyone else is $26 richer, with a $300 profit for the same investment.
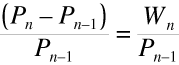
Later, on page 24, when describing the calculation of a, the author
shifts from Wn to DPn, to designate price changes, stating that DPn = Pn
- Pn-1 -- but just a few lines below, the estimated price change
becomes ![]() and an = DeltaPn/on. These changes in the indexes are not understandable, and to be coherent, the formulas should be as follows (assuming DeltaPn+1 is not used to calculate o):
and an = DeltaPn/on. These changes in the indexes are not understandable, and to be coherent, the formulas should be as follows (assuming DeltaPn+1 is not used to calculate o):
![]()
and
![]()
Finally, on page 26, Martinelli states that "...a trader employing the current scheme realizes 56% more return than an investor holding the stock."
If we use his numbers, we see that the buy-and-hold position for GM was -0.266 (lost 26.6%, or was left with 73.4% of the initial capital) and the optimal Ldf was 0.294 (gained 29.4% or ended with 129.4% of the initial capital). In an investment of $1,000, we are comparing $1,294 with $734, and that is a 76.3% difference (1294 : 734 - 1). Once again, there is a confusion between subtraction and division, and that results in a substantial difference.
Marco Alves
Portugal
Rick Martinelli replies:
My thanks to Mr. Alves for pointing out this problem. Indeed, an investment of D dollars on day zero that is allowed to "ride" as implied by my claim that "an investment of D dollars on day zero results in a profit/loss of D*Fk on day k" would dramatically alter the equations. However, this text should be replaced with "an investment of D dollars each day results in a profit/loss of D*Fk on day k" (a change that was lost during revisions).
The situation is clarified some 14 lines later with, "A wager of one unit is placed and the resulting profit/loss taken at the close on the following day (there is no explicit sell signal). Each day's profit/loss is added to the previous day's total to get the fortune to date..."
But, alas, the damage was already done. To elaborate, the quantity:
clearly the daily fractional change in a stock's price on day n. Consequently:

represents the dollars won or lost on day n. Since:
is the sum of these amounts over k days, then, provided D dollars are invested each day, D*Fk does represent the profit/loss after k days, as claimed.
My apologies to your readers for any confusion and, again, my thanks to Mr. Alves for his insight.
ERRATA: EXPLORE YOUR OPTIONS
Editor,
I was alarmed to see a mistake in the November 2006 "Explore Your Options" column. On page 62 of that issue, it gives the following example:
"Say XYZ is trading for $50 a share and I buy the XYZ December 55 call for $2.50 a contract. Now, suppose XYZ shares rally 10% to $55. In that the case, the option strategist has a profit of at least $2.50 a contract, which is equal to the current stock price ($55) minus the strike price (50) minus the cost of the trade, $2.50."
This statement is in error. The first sentence states "I buy the XYZ December 55 call..." The second sentence then says the position now has at least a profit of $2.50 a contract, because "the current stock price ($55) minus the strike price (50) minus the cost of the trade, $2.50." Note that the strike price of the option purchased is the "XYZ December 55 call" (first sentence) not the "(50) strike price" (second sentence).
Assuming the first sentence is correct and does not contain a typo, then the situation is as follows: a 55 call is purchased for $2.50, the underlying then increases 10% to $55/share. The position is now at-the-money. It has no intrinsic value. Depending on time to expiration and implied volatility, the 55 call may be worth very little. Certainly, it could be worth nowhere near $2.50.
Maybe this was a typo. Maybe the example intended to establish a position by buying a December 50 call (which is at-the-money with the underlying at $50.00/share) for $2.50. Then the math works. If the stock goes to $55/share, the 50 call has intrinsic value of $5.00. Less the cost of putting on the position (a debit of $2.50) results in a positional gain of $2.50.
Would you kindly elaborate? Thank you very much.
Dana J. Stotsky
Fred Ruffy of Optionetics replies:
The astute reader is correct. The first sentence should have read "December 50" call. Not "December 55."
The last sentence in the first paragraph is correct, the strike price
is 50,
not 55.
This was a typographical error that was overlooked. My apologies for this mistake.
Back to January 2007 Contents
Originally published in the January 2007 issue of Technical Analysis
of STOCKS & COMMODITIES magazine.
All rights reserved. © Copyright 2006, Technical Analysis,
Inc.