December 2006
TRADERS' TIPS
You can copy these formulas and programs for easy use in your spreadsheet or analysis software. Simply "select" the desired text by highlighting as you would in any word processing program, then use your standard key command for copy or choose "copy" from the browser menu. The copied text can then be "pasted" into any open spreadsheet or other software by selecting an insertion point and executing a paste command. By toggling back and forth between an application window and the open Web page, data can be transferred with ease.
This month's tips include formulas and programs for:
![]() METASTOCK:
STOCHASTICS WITH LONG-TERM EMA FILTER
METASTOCK:
STOCHASTICS WITH LONG-TERM EMA FILTER
![]() TRADESTATION:
STOCHASTICS WITH LONG-TERM EMA FILTER
TRADESTATION:
STOCHASTICS WITH LONG-TERM EMA FILTER
![]() eSIGNAL:
STOCHASTICS WITH LONG-TERM EMA FILTER
eSIGNAL:
STOCHASTICS WITH LONG-TERM EMA FILTER
![]() AMIBROKER:
STOCHASTICS WITH LONG-TERM EMA FILTER
AMIBROKER:
STOCHASTICS WITH LONG-TERM EMA FILTER
![]() WEALTH-LAB:
STOCHASTICS WITH LONG-TERM EMA FILTER
WEALTH-LAB:
STOCHASTICS WITH LONG-TERM EMA FILTER
![]() NEUROSHELL
TRADER: STOCHASTICS WITH LONG-TERM EMA FILTER
NEUROSHELL
TRADER: STOCHASTICS WITH LONG-TERM EMA FILTER
![]() NEOTICKER:
STOCHASTICS WITH LONG-TERM EMA FILTER
NEOTICKER:
STOCHASTICS WITH LONG-TERM EMA FILTER
![]() AIQ:
STOCHASTICS WITH LONG-TERM EMA FILTER
AIQ:
STOCHASTICS WITH LONG-TERM EMA FILTER
![]() TRADECISION:
STOCHASTICS WITH LONG-TERM EMA FILTER
TRADECISION:
STOCHASTICS WITH LONG-TERM EMA FILTER
![]() STRATASEARCH:
STOCHASTICS WITH LONG-TERM EMA FILTER
STRATASEARCH:
STOCHASTICS WITH LONG-TERM EMA FILTER
![]() ASPEN
GRAPHICS: STOCHASTICS WITH LONG-TERM EMA FILTER
ASPEN
GRAPHICS: STOCHASTICS WITH LONG-TERM EMA FILTER
![]() TRADINGSOLUTIONS:
STOCHASTICS WITH LONG-TERM EMA FILTER
TRADINGSOLUTIONS:
STOCHASTICS WITH LONG-TERM EMA FILTER
![]() MULTICHARTS:
STOCHASTICS WITH LONG-TERM EMA FILTER
MULTICHARTS:
STOCHASTICS WITH LONG-TERM EMA FILTER
![]() VT
TRADER: STOCHASTICS WITH LONG-TERM EMA FILTER
VT
TRADER: STOCHASTICS WITH LONG-TERM EMA FILTER
![]() TECHNIFILTER
PLUS: STOCHASTICS WITH LONG-TERM EMA FILTER
TECHNIFILTER
PLUS: STOCHASTICS WITH LONG-TERM EMA FILTER
![]() TRADE
NAVIGATOR/TRADESENSE: STOCHASTICS WITH LONG-TERM EMA FILTER
TRADE
NAVIGATOR/TRADESENSE: STOCHASTICS WITH LONG-TERM EMA FILTER
or return to December 2006 Contents
EDITOR'S NOTE: This month's Traders' Tips are based on the sidebar to our interview with Robert Colby in this issue, which describes the stochastics with long-term EMA filter technique.Code written in MetaStock format is already provided in the sidebar by Robert Colby. Additional code for other technical analysis programs is presented here.
For subscribers, code given in the Colby interview sidebar can be copied and pasted into MetaStock from the Subscriber Area at www.Traders.com. Login is required.
METASTOCK: STOCHASTICS WITH LONG-TERM EMA FILTER
Editor's note: The MetaStock code for Robert Colby's stochastics with a long-term EMA filter technique was already provided in the sidebar to the interview in this issue.
TRADESTATION: STOCHASTICS WITH LONG-TERM EMA FILTER
The interview with Robert Colby in this issue, which includes the sidebar "Stochastics With Long-Term EMA Filter," describes a trading strategy based on filtered stochastics. When prices are above a long-term moving average, the strategy buys during price corrections. When prices are below the average, the strategy sells short during rallies.
The article provides a performance report for the period 1981-2006 based on a synthetic SPY price history. Since the SPY exchange traded fund (ETF) began trading in 1993, the SPY and S&P 500 index datafiles were merged to create the synthetic price history. Although the synthetic data on which we tested our EasyLanguage code probably differs slightly from Colby's, the strategy's performance is similar to what was reported in the article. A sample result can be seen in Figure 1.
FIGURE 1: TRADESTATION, STOCHASTICS WITH A LONG-TERM EMA FILTER. Here is a daily chart of synthetic SPY data, with the Colby stochastic indicator and strategy applied.
To download the EasyLanguage indicator and strategy code for this
article, search for the file "Colby.Eld" in the Support Center at TradeStation.com.
Indicator:  Stochastic-Colby
inputs:
 Opt1( 7 ),
 Opt2( 3 ),
 Opt3( 20 ) ;
variables:
 FastKValue( 0 ),
 PctK( 0 ),
 FracOpt3( 0 ),
 OverSold( 0 ),
 OverBought( 0 ) ;
FastKValue = 0.01 * FastKCustom( Close, Close, Close,
 Opt1 ) ;
{ Alternative calculation using highs and lows:
  FastKValue = FastK( Opt1 ) ; }
PctK = Average( FastKValue, Opt2 ) ;
FracOpt3 = 0.01 * Opt3 ;
OverSold = 0.5 - FracOpt3 ;
OverBought = 0.5 + FracOpt3 ;
Plot1( PctK, "PctK" ) ;
Plot2( OverBought, "OverBought" ) ;
Plot3( OverSold, "OverSold" ) ;
Strategy:  Stochastic-Colby
inputs:
 InitialInv( 1000 ),
 MarginFactor( 1 ),
 Opt1( 7 ),
 Opt2( 3 ),
 Opt3( 20 ),
 Opt4( 271 ) ;
variables:
 BuyingPower( 0 ),
 PositionSize( 0 ),
 FastKValue( 0 ),
 PctK( 0 ),
 ExpMovAvg( 0 ),
 FracOpt3( 0 ),
 OverSold( 0 ),
 OverBought( 0 ) ;
BuyingPower = ( InitialInv + NetProfit +
 OpenPositionProfit ) * ( 1 + MarginFactor ) ;
if Close <> 0 then
 PositionSize = IntPortion( BuyingPower / Close ) ;
FastKValue = 0.01 * FastKCustom( Close, Close, Close,
 Opt1 ) ;
{ Alternative calculation using highs and lows:
  FastKValue = FastK( Opt1 ) ; }
PctK = Average( FastKValue, Opt2 ) ;
ExpMovAvg = XAverage( Close[1], Opt4 ) ;
FracOpt3 = 0.01 * Opt3 ;
OverSold = 0.5 - FracOpt3 ;
OverBought = 0.5 + FracOpt3 ;
if PctK < OverSold and Close > ExpMovAvg then
 Buy PositionSize shares this bar Close
else if PctK > OverBought and Close < ExpMovAvg then
 SellShort PositionSize shares this bar at Close ;
if PctK > OverBought or Close < ExpMovAvg then
 Sell this bar at Close ;
if PctK < OverSold or Close > ExpMovAvg then
 Buy to Cover this bar Close ;
--Mark Mills
TradeStation Securities, Inc.
www.TradeStation.com
eSIGNAL: STOCHASTICS WITH LONG-TERM EMA FILTER
For this month's Traders' Tips formula based on the interview with Robert Colby in this issue, we've provided the formula "Colby_StochEmaFilter.efs." The study has been coded for backtesting with the Strategy Analyzer as well as for processing real-time data.
There are several formula parameters that may be configured through the Edit Studies option in the Advanced Chart. The upper and lower bands for the stochastic study may be adjusted, which are set to the defaults of 70 and 30, respectively. The number of periods for the exponential moving average (EMA), stochastic %K periods, and smoothing periods for the stochastic %K are also adjustable.
This study is a nonprice study, which plots the stochastic %K for visual reference. The EMA study cannot be plotted at the same time in the price pane by this formula. Figure 2 displays an EMA study, which was applied to the chart separately from the Basic Studies menu and set to a 271-period EMA of the close.
FIGURE 2: eSIGNAL, STOCHASTICS WITH A LONG-TERM EMA FILTER. This study is a nonprice study, which plots the stochastic %K for visual reference. The EMA study is set to a 271-period EMA of the close.
To provide a visual reference in the nonprice pane to indicate the
relation of the prices to the EMA, the background of the study is colored
green or red. Green indicates that the price is currently above the EMA
and red when below.
The price bars are also colored green and red based on this scheme.
The trade signals are indicated with "long" and "short" labels for entries
and an "X" labels for the closing trade signals. While the system is holding
a long or short position, a yellow bar is drawn at the top or bottom of
the study pane to highlight the duration of each position.
/***************************************
Provided By : eSignal (c) Copyright 2006
Description:  Stochastics With Long Term EMA Filter
              by Robert Colby
Version 1.0  10/09/2006
Notes:
* Dec 2006 Issue of Stocks and Commodities Magazine
* Study requires at least 271 bars of data.
* As a non-price study, the formula uses the EMA study as
    part of the conditions for the trade signal but cannot
    plot the EMA on the price chart simultaneously with the StochK.
    If desired, add the EMA study to the price pane with the EMA
    from Basic Studies menu (use Length 271 with Close as the Source).
* When the Close is above the 271-period EMA the top half of the study
    pane's background will be colored green.  When the Close is below
    the 271-period EMA, the bottom half of the study pane's background
    will be colored red.  In addition to the background of the study
    pane, the price bars will be will also be colored to match the
    background coloring scheme.
Formula Parameters:                     Default:
Stoch Upper Band                        70
Stoch Lower Band                        30
EMA Periods                             271
StochK Periods                          7
StochK Smoothing                        3
*****************************************************************/
function preMain() {
    setStudyTitle("Stochastics with EMA Filter ");
    setCursorLabelName("EMA", 0);
    setCursorLabelName("StochK", 1);
    setDefaultBarFgColor(Color.navy, 1);
    setDefaultBarThickness(2, 1);
    setShowTitleParameters(false);
    setColorPriceBars(true);
    setDefaultPriceBarColor(Color.grey);

    var fp1 = new FunctionParameter("nUpperBand", FunctionParameter.NUMBER);
        fp1.setName("Stoch Upper Band");
        fp1.setLowerLimit(0);
        fp1.setDefault(70);

    var fp2 = new FunctionParameter("nLowerBand", FunctionParameter.NUMBER);
        fp2.setName("Stoch Lower Band");
        fp2.setLowerLimit(0);
        fp2.setDefault(30);
    var fp3 = new FunctionParameter("nMAlen", FunctionParameter.NUMBER);
        fp3.setName("EMA Periods");
        fp3.setLowerLimit(1);
        fp3.setDefault(271);
    var fp4 = new FunctionParameter("nKlen", FunctionParameter.NUMBER);
        fp4.setName("StochK Periods");
        fp4.setLowerLimit(1);
        fp4.setDefault(7);
    var fp5 = new FunctionParameter("nKsma", FunctionParameter.NUMBER);
        fp5.setName("StochK Smoothing");
        fp5.setLowerLimit(1);
        fp5.setDefault(3);
}
// Global Variables
var bVersion  = null;    // Version flag
var bInit     = false;   // Initialization flag
var xMA       = null;    // EMA series
var xStochK   = null;    // StochK series
// Strategy Variables
var vPosition = 0;      // position status (1=long, 0=flat, -1=short)
var bRealTime = false;  // back testing flag
function main(nUpperBand, nLowerBand, nMAlen, nKlen, nKsma) {
    if (bVersion == null) bVersion = verify();
    if (bVersion == false) return;
    var nState = getBarState();
    var nIndex = getCurrentBarIndex();
    var c      = close(0);
    var c_1    = close(-1);
    //Initialization
    if (bInit == false) {
        addBand(nUpperBand, PS_SOLID, 1, Color.blue, "upper");
        addBand(nLowerBand, PS_SOLID, 1, Color.blue, "lower");
        xMA = ema(nMAlen);
        xStochK = stochK(nKlen, nKsma, 1);
        bInit = true;
    }

    var nEMA   = xMA.getValue(0);
    var nEMA_1 = xMA.getValue(-1);
    var nK     = xStochK.getValue(0);
    var nK_1   = xStochK.getValue(-1);
    if (nEMA_1 == null || nK_1 == null) return;  // null check

    if (nIndex == 0) bRealTime = true;

    //Coloring scheme for close vs. EMA
    if (c >= nEMA) {
        setBarBgColor(Color.green, 0, 100, 50);
        setPriceBarColor(Color.green);
    } else {
        setBarBgColor(Color.red, 0, 50, 0);
        setPriceBarColor(Color.red);
    }


    // Exit Signals
    if (nState == BARSTATE_NEWBAR && vPosition != 0) {
        if (vPosition == 1) {           // long
            if (c_1 < nEMA_1 || nK_1 > nUpperBand) {
                drawTextRelative(0, 50, "X", Color.white, Color.maroon,
                    Text.CENTER|Text.FRAME|Text.BOLD|Text.BOTTOM, null, 10);
                drawShape(Shape.SQUARE, TopRow1, Color.khaki);
                vPosition = 0;
                if (bRealTime == false) { // back test
                    Strategy.doSell("Long Exit", Strategy.MARKET, Strategy.THISBAR);
                }
            }
        } else if (vPosition == -1) {   // short
            if (c_1 > nEMA_1 || nK_1 < nLowerBand) {
                drawTextRelative(0, 50, "X", Color.white, Color.maroon,
                    Text.CENTER|Text.FRAME|Text.BOLD|Text.TOP, null, 10);
                drawShape(Shape.SQUARE, BottomRow1, Color.khaki);
                vPosition = 0;
                if (bRealTime == false) { // back test
                    Strategy.doCover("Short Exit", Strategy.MARKET, Strategy.THISBAR);
                }
            }
        }
    }

    // Entry Signals
    if (nState == BARSTATE_NEWBAR) {
        if (vPosition != 1) {  // long
            if (nK_1 < nLowerBand && c_1 > nEMA_1) {
                drawTextRelative(0, 50, "Long", Color.white, Color.blue,
                    Text.RIGHT|Text.FRAME|Text.BOLD|Text.TOP, null, 10);
                vPosition = 1;
                if (bRealTime == false) { // back test
                    Strategy.doLong("Long Entry", Strategy.MARKET, Strategy.THISBAR);
                }
            }
        }
        if (vPosition != -1) {  // short
            if (nK_1 > nUpperBand && c_1 < nEMA_1) {
                drawTextRelative(0, 50, "Short", Color.white, Color.blue,
                    Text.RIGHT|Text.FRAME|Text.BOLD|Text.BOTTOM, null, 10);
                vPosition = -1;
                if (bRealTime == false) { // back test
                    Strategy.doShort("Short Entry", Strategy.MARKET, Strategy.THISBAR);
                }
            }
        }
    }

    // Position status
    if (vPosition == 1) {
        drawShape(Shape.SQUARE, TopRow1, Color.khaki);
    } else if (vPosition == -1) {
        drawShape(Shape.SQUARE, BottomRow1, Color.khaki);
    }

    return new Array(nEMA.toFixed(4), nK);
}
function verify() {
    var b = false;
    if (getBuildNumber() < 779) {
        drawTextAbsolute(5, 35, "This study requires version 8.0 or later.",
            Color.white, Color.blue, Text.RELATIVETOBOTTOM|Text.RELATIVETOLEFT|Text.BOLD|Text.LEFT,
            null, 13, "error");
        drawTextAbsolute(5, 20, "Click HERE to upgrade.@URL=https://www.esignal.com/download/default.asp",
            Color.white, Color.blue, Text.RELATIVETOBOTTOM|Text.RELATIVETOLEFT|Text.BOLD|Text.LEFT,
            null, 13, "upgrade");
        return b;
    } else {
        b = true;
    }

    return b;
}
To discuss these studies or download a complete copy of the code,
please visit the EFS Library Discussion Board forum under the Bulletin
Boards link at www.esignalcentral.com. The eSignal formula scripts (EFS)
are also available for copying and pasting from the STOCKS & COMMODITIES
website at Traders.com.
--Jason Keck
eSignal, a division of Interactive Data Corp.
800 815-8256, www.esignalcentral.com
AMIBROKER: STOCHASTICS WITH LONG-TERM EMA FILTER
In the interview with Robert Colby in this issue, a system titled "Stochastics
with long-term EMA filter" is presented. Implementing such a system is
straightforward using the AmiBroker Formula Language. Listing 1 shows a
ready-to-use formula. To backtest the system, open the Formula Editor,
copy the formula from Listing 1, and then select Tools -> Backtest menu.
LISTING 1
Opt1 = Optimize("Opt1", 7, 1, 20, 1 );
Opt2 = Optimize("Opt2", 3, 1, 20, 1 );
Opt3 = Optimize("Opt3", 20, 10, 30, 1 );
Opt4 = Optimize("Opt4", 271, 100, 300, 1 );
sto = ( C - LLV( C, Opt1 ) ) / ( HHV( C, Opt1 ) - LLV( C, Opt1 ) );
stoma = MA( sto, Opt2 );
ema4 = EMA( C, Opt4 );
Buy = stoma < 0.5 - 0.01 * Opt3 AND C > ema4;
Sell = stoma > 0.5 + 0.01 * Opt3 OR C  < ema4;
Short = stoma > 0.5 + 0.01 * Opt3 AND C < ema4;
Cover = stoma < 0.5 - 0.01 * Opt3 OR C > ema4;
A sample chart is shown in Figure 3.
FIGURE 3: AMIBROKER, STOCHASTICS WITH A LONG-TERM EMA FILTER. This screenshot shows sample results of a backtest of Robert Colby's trading system.--Tomasz Janeczko, AmiBroker.com
www.amibroker.com
WEALTH-LAB: STOCHASTICS WITH LONG-TERM EMA FILTER
The WealthScript code given here for Robert Colby's "Stochastics With Long-Term EMA Filter" strategy includes the trading rules, plot code, and is prepared for optimization. For tradability, we programmed the system to execute market orders on the day following a trading signal.
Taking a quick look at one of the six possible optimization spaces for four variables, we see that #OptVar4, the EMA period, significantly influences profit. While we used a shorter test period (January 1993-October 2006), the graph indicates that values in the range 250 to 280 are good choices for a stable system -- that is, a profitable range of values with no steep dropoffs. Conversely, choosing a more-profitable value near 230 would be an example of overfitting.
A sample chart is shown in Figure 4. Visit the ChartScript Center at
www.wealth-lab.com and run this script on your favorite symbol!
FIGURE 4: WEALTH-LAB, STOCHASTICS WITH A LONG-TERM EMA FILTER. When optimizing, choose parameters from the optimization space that yield a profitable range of values.
WealthScript code:
{#OptVar1 7;4;11;1}
{#OptVar2 3;2;8;1}
{#OptVar3 20;10;26;2}
{#OptVar4 271;151;301;10}
var Bar, StoPane, hStoK, hEMA, stoPer, emaPer, stoSmooth, stoTrig: integer;
var C, trigHi, trigLo: float;
var Buy, Sell: boolean;
stoPer    := #OptVar1;
stoSmooth := #OptVar2;
stoTrig   := #OptVar3;
emaPer    := #OptVar4;
trigHi := 50 + stoTrig;
trigLo := 50 - stoTrig;
{ Create and plot indicators }
HideVolume;
StoPane := CreatePane( 75, false, true );
hStoK := SMASeries( StochKSeries( stoPer ), stoSmooth );
hEMA := EMASeries( #Close, emaPer );
PlotSeriesLabel( hEMA, 0, #Gray, #Thick, 'EMA' );
PlotSeriesLabel( hStoK, StoPane, #Teal, #Thin, 'StochK(smoothed)' );
for Bar := 2 * emaPer to BarCount - 1 do
begin
  C := PriceClose( Bar );
  Buy  := ( @hStoK[Bar] < trigLo ) and ( C > @hEMA[Bar] );
  Sell := ( @hStoK[Bar] > trigHi ) and ( C < @hEMA[Bar] );
  case MarketPosition of
    0: // No Position
      if Buy then
        BuyAtMarket( Bar + 1, '' )
      else if Sell then
        ShortAtMarket( Bar + 1, '' );
    1: // Holding long
      if Sell then
      begin
        SellAtMarket( Bar + 1, LastPosition, '' );
        ShortAtMarket( Bar + 1, '' );
      end;
   -1: // Holding short
      if Buy then
      begin
        CoverAtMarket( Bar + 1, LastPosition, '' );
        BuyAtMarket( Bar + 1, '' )
      end;
  end;
end;
-- Robert Sucher
www.wealth-lab.com
NEUROSHELL TRADER: STOCHASTICS WITH LONG-TERM EMA FILTER
The stochastics with long-term EMA filter strategy described by Robert Colby in this issue can be easily implemented in NeuroShell Trader by combining a few of the NeuroShell Trader's 800+ indicators in a trading strategy.
To recreate the strategy, select "New Trading Strategy ..." from the "Insert"
menu and enter the following entry and exit conditions in the appropriate
locations of the Trading Strategy Wizard:
Generate a buy long MARKET order if ALL of the following are true:
 A<B ( MovAvg( Stoch%K( High, Low, Close, 7), 3), 30 )
 A>B ( Close, Lag( ExpAvg( Close, 271 ), 1)
Generate a sell long MARKET order if ONE of the following are true:
 A>B ( MovAvg( Stoch%K( High, Low, Close, 7), 3), 70 )
 A<B ( Close, Lag( ExpAvg( Close, 271 ), 1)
Generate a sell short MARKET order if ALL of the following are true:
 A>B ( MovAvg( Stoch%K( High, Low, Close, 7), 3), 70 )
 A<B ( Close, Lag( ExpAvg( Close, 271 ), 1)
Generate a cover short MARKET order if ONE of the following are true:
 A<B ( MovAvg( Stoch%K( High, Low, Close, 7), 3), 30 )
 A>B ( Close, Lag( ExpAvg( Close, 271 ), 1)
If you have NeuroShell Trader Professional, you can also choose
whether the system parameters should be optimized. After backtesting the
trading strategy, use the "Detailed Analysis ..." button to view the backtest
and trade-by-trade statistics for the stochastics with long-term Ema filter
trading system.
For more information on NeuroShell Trader, visit www.NeuroShell.com.
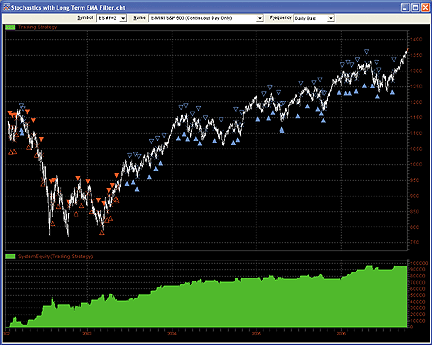
FIGURE 5: NEUROSHELL, STOCHASTICS WITH A LONG-TERM EMA FILTER. Here is a sample NeuroShell chart demonstrating the stochastics with long-term EMA filter system.
--Marge Sherald, Ward Systems Group, Inc.
301 662-7950, sales@wardsystems.com
www.neuroshell.com
NEOTICKER: STOCHASTICS WITH LONG-TERM EMA FILTER
NeoTicker has an indicator called Backtest EZ that enables users to enter long/short entry/exit rules in NeoTicker formula language to quickly and easily test trading ideas.
The long/short entry/exit rules from the interview with Robert Colby written in NeoTicker formula are shown in Listing 1. After putting in all formulas into the corresponding fields in Backtest EZ, apply the indicator to a daily ES chart. An equity curve resulting from the trading signals will be displayed on the NeoTicker chart (Figure 6). To see a detailed report with system statistics (Figure 7), right-click on the equity curve and select Trading System> Performance Viewer.
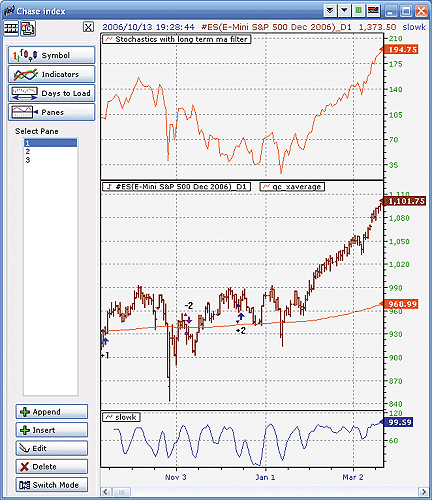
FIGURE 6: NEOTICKER, STOCHASTICS WITH A LONG-TERM EMA FILTER. After putting in all formulas to the Backtest EZ, apply the indicator to a daily ES chart. An equity curve resulting from the trading signals will be displayed.
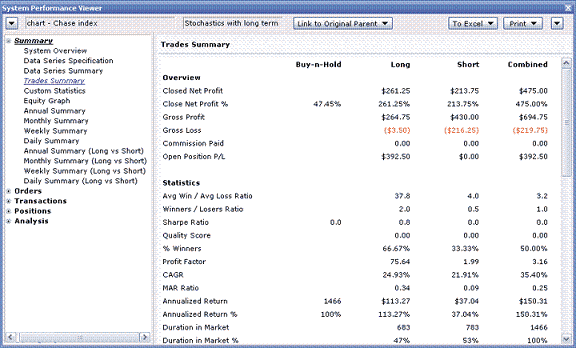
FIGURE 7: NEOTICKER, STATISTICS REPORT. To see a detailed report with system statistics, right-click on the equity curve and select Trading System> Performance Viewer.
An exported chart group containing the Backtest EZ indicator will be available for download at the NeoTicker blog site (https://blog.neoticker.com).LISTING 1 Enter Long: (slowk(data1,7,3) < 30) and (c > qc_xaverage(1, data1, 271)) Close Long: (slowk(data1, 7, 3) > 70) and (c < qc_xaverage(1, data1, 271)) Enter Short: (slowk(data1,7,3) > 70) and (c < qc_xaverage(1, data1, 271)) Close Short: (slowk(data1,7,3) < 30) and (c > qc_xaverage(1, data1, 271))
--Kenneth Yuen, TickQuest Inc.
www.tickquest.com
AIQ: STOCHASTICS WITH LONG-TERM EMA FILTER
The AIQ code for Robert Colby's "Stochastics With Long-Term EMA Filter" interview sidebar is shown here. The system outlined in the article is a stochastic with moving average trend filter (SMAF) that filters out signals that would go against the long-term trend.
I decided to test the concept on stocks but also added code that uses the exact same rules on the market index, on the group index, and finally on the stock that is within the group. For a signal to be generated, the market must be generating the SMAF signal as well as the group and the stock. I used AIQ's Portfolio Simulator and a 30-day AIQ relative strength to select the strongest signals, taking two positions per day and a limit of five open positions with 20% allocated to each position.
The code provided illustrates how to use the AIQ group and sector structure to provide market and group timing for a system. Due to time constraints, I was only able to run one test on the long side of the system.
Figure 8 shows the equity curve for the period 1995 through October 13, 2006, compared to the S&P 500 index. The market and group filters kept the system from incurring a large drawdown during the bear market of 2001 and 2002, and the results outperform the S&P 500 over the 11-year period tested.
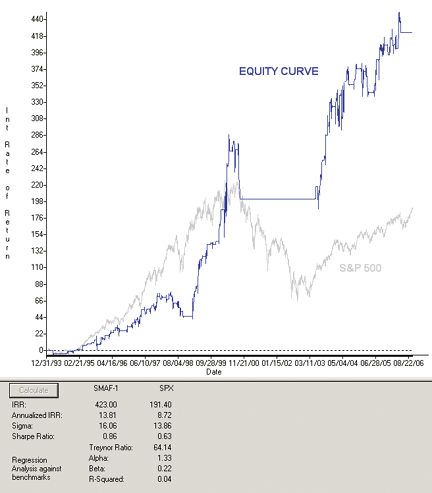
FIGURE 8: AIQ, STOCHASTICS WITH A LONG-TERM EMA FILTER. Here is the equity curve for the SMAF system compared to the S&P 500 index.
This code can be downloaded from the AIQ website at www.aiqsystems.com
or copied and pasted from the STOCKS & COMMODITIES website at Traders.com.
!! STOCHASTICS WITH MOVING AVERAGE FILTER (SMAF)
! Author: Robert Colby, interview, TASC December 2006
! Coded by: Richard Denning 10/09/06
!! STOCHASTICS & SK-SD [%K-%D]
Define  L  7.
Define  S1  3.
! %K NO SMOOTHING:
Stoch  is 100*(([close] - loval([low],L)) / (hival([high],L) - loval([low],L))).
! SMOOTHED %K:
SK  is SimpleAvg(Stoch,S1).
! 271-DAY EXPONENTIAL AVERAGE:
EMA271  is expavg([close],271).
! LONG ENTRY RULE:
LE  if SK<30 and [close] > valresult(EMA271,1)
 and hasdatafor(280)>=271.
! LONG EXIT RULE:
LX  if SK>70 or [close]<valresult(EMA271,1).
! SHORT ENTRY RULE:
SE  if SK>70 and [close]<valresult(EMA271,1)
 and hasdatafor(280)>=271.
! SHORT EXIT RULE:
SX  if SK<30 or [close]>valresult(EMA271,1).
! SMAF AS MARKET TIMING:
LE_MKT  if TickerRule("NDX",LE).
LX_MKT  if TickerRule("NDX",LX).
SE_MKT if TickerRule("NDX",SE).
SX_Mkt if TickerRule("NDX",SX).
! SMAF AS GROUP TIMING:
LE_GRP if TickerRule(RSTicker(),LE).
LX_GRP if TickerRule(RSTicker(),LX).
SE_GRP if TickerRule(RSTicker(),SE).
SX_GRP if TickerRule(RSTicker(),SX).
! PRICE AND VOLUME FILTER:
PV if [close] > 5 and expavg([volume],50) > 5000.
! SMAF AS MARKET, GROUP, & STOCK TIMING:
LE_MGS if LE_MKT and LE_GRP and LE and PV.
LX_MGS if LX_MKT or LX_GRP or LX.
SE_MGS  if SE_MKT and SE_GRP and SE and PV.
SX_MGS if SX_MKT or SX_GRP or SX.
--Richard Denning
AIQ Systems
richard.denning@earthlink.net
TRADECISION: STOCHASTICS WITH LONG-TERM EMA FILTER
To recreate Robert Colby's "Stochastics with long-term EMA filter" strategy, you can use the Strategy Builder in Tradecision, which allows combining strategy and money management rules with the capabilities of the Optimization Wizard and Genetic Algorithms.
To find the optimal parameters, you need to replace the numeric constants in the trading rules with optimization variables. In addition, you need to specify the range (minimum, maximum) and step (increment) for each optimization variable.
Here is the Tradecision code for the stochastics with long-term EMA
filter strategy:
Entry Long
var
   opt1:=#;
   opt2:=#;
   opt3:=#;
   opt4:=#;
   H_L:=Highest(C, opt1) - Lowest(C, opt1);
end_var
if (H_L=0) then return false; {prevent division by zero}
return Mov((C - Lowest(CLOSE, opt1)) / (H_L), opt2, S) < 0.5 - 0.01 * opt3 and
 CLOSE > Mov(CLOSE, opt4, E);
Exit Long
var
   opt1:=#;
   opt2:=#;
   opt3:=#;
   opt4:=#;
   H_L:=Highest(CLOSE, opt1) - Lowest(CLOSE, opt1);
end_var
if (H_L=0) then return false; {prevent division by zero}
return Mov((CLOSE - Lowest(CLOSE, opt1)) / (H_L), opt2, S) > 0.5 + 0.01 * opt3 or
 CLOSE < Mov(CLOSE, opt4, E);
Entry Short
var
   opt1:=#;
   opt2:=#;
   opt3:=#;
   opt4:=#;
   H_L:=Highest(CLOSE, opt1) - Lowest(CLOSE, opt1);
end_var
if (H_L=0) then return false; {prevent division by zero}
return Mov((CLOSE - Lowest(CLOSE, opt1)) / (H_L), opt2, S) >0.5 + 0.01 * opt3 and
 CLOSE < Mov(CLOSE, opt4, E);
Exit Short
var
   opt1:=#;
   opt2:=#;
   opt3:=#;
   opt4:=#;
   H_L:=Highest(CLOSE, opt1) - Lowest(CLOSE, opt1);
end_var
if (H_L=0) then return false; {prevent division by zero}
return Mov((CLOSE - Lowest(CLOSE, opt1)) / (H_L), opt2, S) < 0.5 - 0.01 * opt3 or
 CLOSE > Mov(CLOSE, opt4, E);
After the optimization (Figure 9), you can view and analyze the
Strategy Performance Report and Trades Report on each combination of the
values tested, as well as the combination's equity and drawdown curves.
The best combinations can be saved as separate strategies.
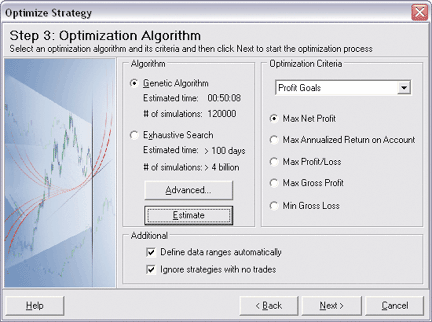
FIGURE 9: TRADECISION, STOCHASTICS WITH A LONG-TERM EMA FILTER. To reduce the time required for optimization, we can either reduce the number of optimization parameters or use genetic algorithms for the optimization. Genetic algorithms possess the best characteristics of the other optimization methods, such as robustness and fast convergence, which does not depend on any of the optimization criteria (for instance, smoothness).
To import the strategy into Tradecision, visit the area "Traders'
Tips from Tasc magazine" at https://tradecision.com/support/tasc_tips/tasc_traders_tips.htm
or copy the code from the STOCKS & COMMODITIES website at www.Traders.com.
--Alex Grechanowski, Alyuda Research, Inc.
alex@alyuda.com, 347 416-6083
www.alyuda.com, www.tradecision.com
STRATASEARCH: STOCHASTICS WITH LONG-TERM EMA FILTER
The stochastics with a long-term EMA filter system provided by Robert Colby in the interview with him in this issue is a nice combination of trading rules. It's important to note, however, that returns have been reported without transaction fees and adjustments taken. When such fees and adjustments are added to create a more realistic simulation, the returns are minimized.
Nevertheless, the system shows great potential if used alongside other
trading rules. When this system is implemented in an automated search,
the use of additional trading rules shows that it can provide a great foundation
for a strong, robust system. StrataSearch allows you to use this system
as a starting point, then automatically test alternate parameter sets or
the use of additional trading rules. A sample chart is shown in Figure
10 and performance summary in Figure 11.
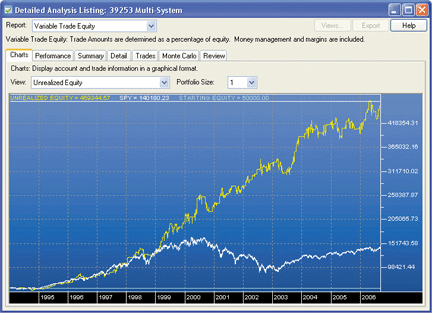
FIGURE 10: STRATASEARCH, STOCHASTICS WITH A LONG-TERM EMA FILTER. Here is a sample equity chart showing Robert Colby's system. Portfolio equity rises along with the SPY prices, but the system has fewer and milder equity drawdowns.
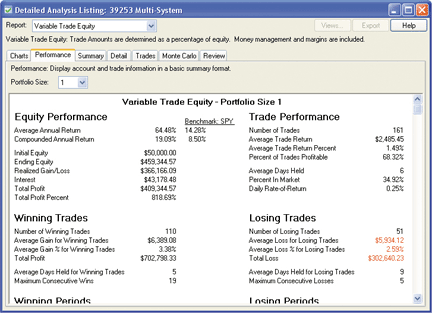
FIGURE 11: STRATASEARCH, PERFORMANCE SUMMARY. As suggested by Robert Colby, the system outperforms a buy & hold approach. Transaction fees and adjustments, however, could minimize the returns.
Long Entry: mov((C-low(C, @opt1)) / (high(C, @opt1)-low(C, @opt1)), @opt2,S) < .5-.01 * @opt3
 AND CLOSE > mov(C, @opt4, E)
Long Exit: mov((C-low(C, @opt1)) / (high(C, @opt1)-low(C, @opt1)), @opt2,S) > .5+.01 * @opt3
 OR CLOSE < mov(C, @opt4, E)
Short Entry: mov((C-low(C, @opt1)) / (high(C, @opt1)-low(C, @opt1)), @opt2,S) > .5+.01 * @opt3
 AND CLOSE < mov(C, @opt4, E)
Short Exit: mov((C-low(C, @opt1)) / (high(C, @opt1)-low(C, @opt1)), @opt2, S) < .5-.01 * @opt3
 OR CLOSE > mov(C, @opt4, E)
@opt1 = 5 to 9 by 1
@opt2 = 2 to 4 by 1
@opt3 = 16 to 24 by 2
@opt4 = 201 to 301 by 10
As with all our other StrataSearch Traders' Tips contributions,
additional information -- including plug-ins -- can be found in the Shared
Area of our user forum. This month's plug-in also contains a number of
prebuilt trading rules that will allow you to include this system in your
automated searches.
--Pete Rast
Avarin Systems, Inc.
www.StrataSearch.com
ASPEN GRAPHICS: STOCHASTICS WITH LONG-TERM EMA FILTER
Aspen Graphics offers several tools for alerting traders to possible entry and exit points. On-chart text representations (that is, string support), custom color rules, email alarms, and quote page notifications are all easily configured for the trading system described by Robert Colby in this issue. The nature of the stochastic study with a long-term EMA filter allows for several methods of notification, and Aspen can deliver them all.
The key to approaching Colby's system in Aspen Graphics is to break the logic into separate formulas. This approach allows a trader to use the results of these formulas in any analysis method available in Aspen Graphics (that is, in overlays or studies for output on charts or quote windows, to trigger an alarm, or to create color rules). See Figures 12 and 13.
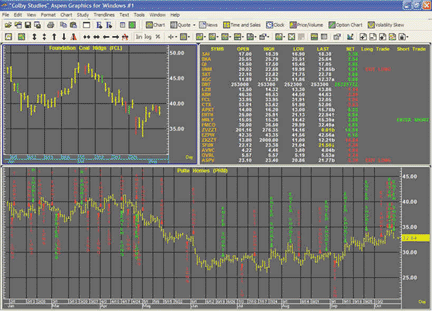
FIGURE 12: ASPEN GRAPHICS, STOCHASTICS WITH A LONG-TERM EMA FILTER. There are several approaches to displaying entry and exit points on the chart.
FIGURE 13: ASPEN GRAPHICS, STOCHASTICS WITH A LONG-TERM EMA FILTER. Long_Trade() and Short_Trade() formulas are added as overlays.
First, combine the indicators related to a long position into one
formula. This formula, "Long_Test()," returns a value of 1 for entry points
and a value of -1 for exit points. Approach the indicators related to the
short position in the same fashion. The Aspen Graphics formulas for the
Long_Test() and the Short_Test() are shown here:
Long_Test(input) = begin
 retval = 0
 if savg( (fstoch($1, 7)), 3) < 30  and $1.close > eavg($1.close, 271)[1]  then retval = 1
 if savg( (fstoch($1, 7)), 3) > 70 or $1.close < eavg($1.close, 271)[1]  then retval = -1
 retval
end
Short_Test(input) = begin
 retval = 0
 if savg( (fstoch($1, 7)), 3) > 70 and $1.close < eavg($1.close, 271)[1] then retval = 1
 if savg( (fstoch($1, 7) ), 3 ) < 30 or $1.close > eavg($1.close, 271)[1] then retval = -1
 retval
end
Now the results of the Long_Test() and Short_Test() formulas
can be used in another formula to produce text on a chart or in a quote
window. This new formula, Long_Trade(), looks for the 1 and -1 results
from the above formulas and returns a formatted string. This formatted
string can then be displayed on a chart or in a quote page. The code for
the Long_Trade() and Short_Trade() formulas follows:
Long_Trade(input) = begin
 retval = nonum
 if chart( ( Long_Test($1) == 1 and Long_Test($1)[1] != 1 ) [-1], 1, 2, 100, 0, 1) then
  retval =  'Enter Long'|clr_green|arrow|below|vertical|ftiny
 if chart( ( Long_Test($1) == -1 and Long_Test($1)[1] != -1 ) [-1], 1, 2, 100, 0, 1) then
  retval = 'Exit Long'|clr_red|arrow|below|vertical|ftiny
 retval
end
Short_Trade(input) = begin
 retval = nonum
 if chart ( ( Short_Test($1) == 1 and Short_Test($1)[1] != 1) [-1], 1, 2, 100, 0, 1) then
  retval = 'Enter Short'|clr_green|arrow|above|vertical|ftiny
 if chart ( ( Short_Test($1) == -1 and Short_Test($1)[1] != -1) [-1], 1, 2, 100, 0, 1) then
  retval = 'Exit Short'|clr_red|arrow|above|vertical|ftiny
 retval
end
Custom color rules and email alarms utilize the numeric results
of the Long_Test() and Short_Test() formulas.
The following code is used in an alarm to monitor the front-month S&P
contract for entry positions based on Colby's system. Note that we call
the Long_Test() formula from within the alarm. (Important note: Aspen Graphics
alarm syntax must be symbol-specific.)
Chart((Long_Test(sp#))[-1], 1, 1, 100, 1, 1) == 1 and
 Chart((Long_Test(sp#))[-1], 1, 1, 100, 1, 1)[1] != 1
This Aspen Graphics alarm configuration generates audio and visual
alerts (Figure 14). It also sends an email alerting one or more recipients
to the market's condition.
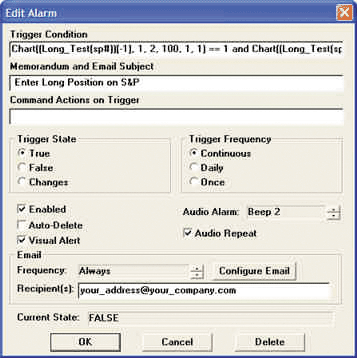
FIGURE 14: ASPEN GRAPHICS, CONFIGURING THE EMAIL ALARM. This Aspen Graphics alarm configuration generates audio and visual alerts. It also sends an email alerting one or more recipients to the market's condition.
There are many other ways that an Aspen Graphics user can
employ Colby's method, but there isn't sufficient space available in this
article to explore those alternatives. For the benefit of our Aspen Graphics
users, we have created a full-page suite containing the formulas mentioned
in this month's article. The page suite contains the on-chart text notifications,
the quote page text notifications, custom color rules, and alarm configurations
for the entire trading system. The December 2006 Traders' Tips page suite
is available via our FTP site at ftp://ftp.aspenres.com/Traders%20Tips/.
You may also contact an Aspen Graphics Support Technician at support@aspenres.com
or 970 945-2921.
--Jeremiah Adams
Aspen Graphics Technical Support
support@aspenres.com, www.aspenres.com
TRADINGSOLUTIONS: STOCHASTICS WITH LONG-TERM EMA FILTER
In the interview with Robert Colby in this issue with the accompanying sidebar, "Stochastics With Long-Term EMA Filter," a trading system is described that takes into account a stochastic oscillator and a long-term exponential moving average.
This system can be entered into TradingSolutions as follows. Note that
the variable names and full stochastic formula are kept the same as they
were in the interview to allow better understanding of how the formula
was converted to TradingSolutions.
System Name: Stochastics with Long-Term EMA Filter
Inputs: Close, Opt1, Opt2, Opt3, Opt4
Enter Long when all of these true:
1. LT (MA (Div (Sub (Close, Lowest (Close, Opt1)), Sub (Highest (Close, Opt1),
 Lowest (Close, Opt1))), Opt2 ), Sub (0.5, Mult(0.01, Opt3)))
2. GT(Close , EMA(Close, Opt4))
Exit Long when any of these true:
1. GT (MA (Div (Sub (Close, Lowest (Close, Opt1)), Sub (Highest (Close, Opt1),
 Lowest (Close, Opt1))), Opt2 ), Add (0.5, Mult(0.01, Opt3)))
2. LT(Close , EMA(Close, Opt4))
Enter Short when all of these true:
1. GT (MA (Div (Sub (Close, Lowest (Close, Opt1)), Sub (Highest (Close, Opt1),
 Lowest (Close, Opt1))), Opt2 ), Add (0.5, Mult(0.01, Opt3)))
2. LT(Close , EMA(Close, Opt4))
Exit Short when any of these true:
1. LT (MA (Div (Sub (Close, Lowest (Close, Opt1)), Sub (Highest (Close, Opt1),
 Lowest (Close, Opt1))), Opt2 ), Sub (0.5, Mult(0.01, Opt3)))
2. GT(Close , EMA(Close, Opt4))
This system is also available as a function file that can be downloaded
from the TradingSolutions website (www.tradingsolutions.com) in the Solution
Library section.
--Gary Geniesse
NeuroDimension, Inc.
800 634-3327, 352 377-5144
www.tradingsolutions.com
MULTICHARTS: STOCHASTICS WITH LONG-TERM EMA FILTER
The entry and exit rules based on Robert Colby's stochastic with a long-term
EMA filter and the MultiCharts system-testing rules are written as follows:
inputs:
 OPT1(7),
 OPT2(3),
 OPT3(20),
 OPT4(271);
if highest(close, OPT1) - lowest(close,OPT1) <> 0 then begin
 if average( (close - lowest(close, OPT1)) / (highest(close, OPT1) -
  lowest(close,OPT1)), OPT2) < .5 - .01 * OPT3 and close > xaverage(close,OPT4) then
   buy this bar at close;
 if average( (close - lowest(close, OPT1)) / (highest(close, OPT1) -
  lowest(close,OPT1)), OPT2) > .5 - .01 * OPT3 or close < xaverage(close,OPT4) then
   sell this bar at close;
 if average( (close - lowest(close, OPT1)) / (highest(close, OPT1) -
  lowest(close,OPT1)), OPT2) > .5 - .01 * OPT3 and close < xaverage(close,OPT4) then
   sell short this bar at close;
 if average( (close - lowest(close, OPT1)) / (highest(close, OPT1) -
  lowest(close,OPT1)), OPT2) < .5 - .01 * OPT3 or close > xaverage(close,OPT4) then
   buy to cover this bar at close;
end;
The result of applying the strategy to MultiCharts is demonstrated
on the chart in Figure 15. To discuss this article or download a complete
copy of the formulas, please visit our discussion forum at forum.tssupport.com.
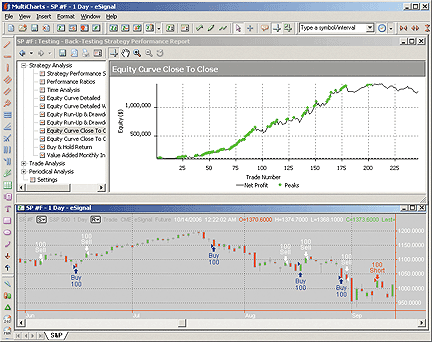
FIGURE 15: MULTICHARTS, STOCHASTICS WITH A LONG-TERM EMA FILTER. On this daily chart of S&P futures, you can see how the strategy fared.
--Stanley Miller
TS SUPPORT, LLC
www.tssupport.com
VT TRADER: STOCHASTICS WITH LONG-TERM EMA FILTER
This month's Traders' Tip section features a countertrend trading system as discussed by Robert Colby in this issue's interview. The trading system's logic is rather simple and can be mechanically traded, thereby eliminating human subjectivity and judgment.
Long entry signals are generated when the stochastic is less than 30 and the closing price is greater than the 271-period exponential moving average (EMA). Long exit signals are generated when the stochastic is greater than 70 or the closing price is less than the 271-period EMA. Short entry signals are generated when the stochastic is greater than 70 and the closing price is less than the 271-period exponential moving average. Short exit signals are generated when the stochastic is less than 30 or the closing price is greater than the 271-period moving average.
We'll be offering this trading system for download in our user forums. The VT Trader code itself and instructions for recreating the stochastic/EMA trading system are too long to show here but can be viewed online at the STOCKS & COMMODITIES website at www.Traders.com in the Traders' Tips area.
A sample chart is shown in Figure 16. To learn more about VT Trader, visit www.cmsfx.com.
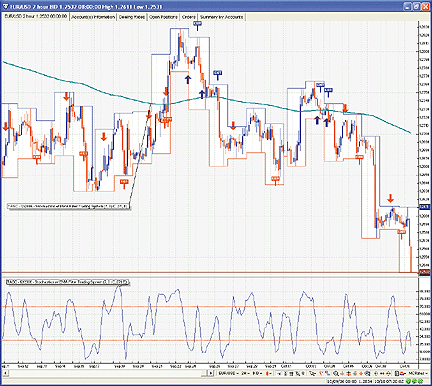
FIGURE 16: VT TRADER, STOCHASTICS WITH A LONG-TERM EMA FILTER. Here is a sample EUR/USD two-hour candlestick chart with the trading system attached.--Chris Skidmore
Visual Trading Systems, LLC (courtesy of CMS Forex)
(866) 51-CMSFX, trading@cmsfx.com
www.cmsfx.com
TECHNIFILTER PLUS: STOCHASTICS WITH LONG-TERM EMA FILTER
Here are the TechniFilter Plus formulas for Robert Colby's stochastics with long-term EMA filter as described in the interview in this issue. (See Figure 17.)
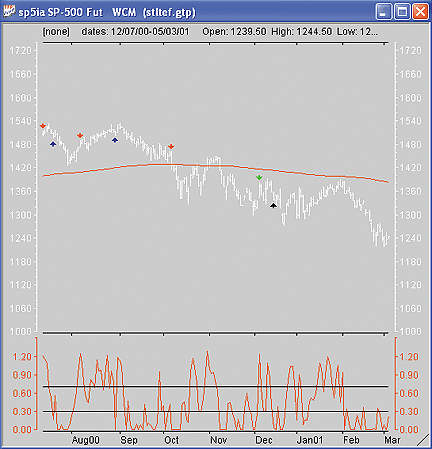
FIGURE 17: TECHNIFILTER, STOCHASTICS WITH A LONG-TERM EMA FILTER
NAME: STOCHASTICS WITH LONG TERM EMA FILTER
TEST TYPE: equal
POSITION LIMIT: none
ENTRY FEE: 0
EXIT FEE: 0
INITIAL INVESTMENT: 100
FORMULAS--------

  [1] Date
  [2] Close
       c
  [3] StochasticRC(7,3)
       (C-CN&1)/ (CM&1 - CN&1)A&2
  [4] LongMA(271)
       CX&1y1
RULES--------

  r1: EnterLOng
       buy long All on Close
       at signal: LongEntry(20)
[3] < (.5-(.01*&1)) & ([2] > [4]) & shares=0
  r2: CloseLong
       stop long All on Close
       at signal: LongClose(70)
[3] > (.5+(.01*&1) )^ ( [2]  < [4])
  r3: OpenShort
       open short all on Close
       at signal: ShortOpen(70)
[3] >(.5+(.01*&1)) & ([2] < [4]) & shares=0
  r4: CloseShort
       stop short all on Close
       at signal: ShortClose(20)
[3]<(.5-(.01*&1)) ^ ([2] > [4])
Visit the home of Technifilter Plus at www.technifilter.com
to download these formulas and filter reports.
--Benzie Pikoos, Brightspark
+61 8 9375-1178, sales@technifilter.com
www.technifilter.com
TRADE NAVIGATOR/TRADESENSE: STOCHASTICS WITH LONG-TERM EMA FILTER
In Trade Navigator Platinum, you can create a strategy and backtest it to see its past performance.
The functions needed to create the Stochastics with Long-Term EMA Filter strategy are already provided for you in Trade Navigator. To create the strategy in Trade Navigator, follow these steps.
Open a new strategy.
(1) Go to the Edit menu and click on Strategies. This will bring up
the Trader's Toolbox already set to the Strategies tab:
(2) Click on the New button. This will open a New Strategy window. (FIGURE
2) If you are asked if you would like to use the Wizard, click the NO button.
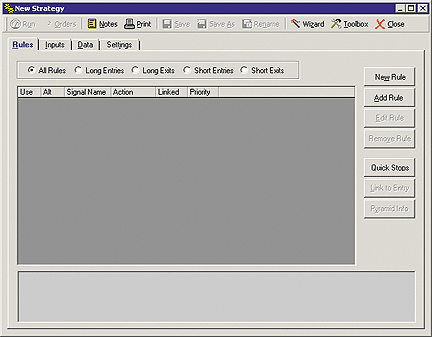
Now you are ready to create rules for your strategy.
Long Entry Buy
(1) Click on the New Rule button.
(2) You will be asked if you would like to use the Condition Builder.
In this case click No. This will take you to the New Rule window.
(3) Type the formula IF StochK (7 , 3) < 30 And Close > MovingAvgX
(Close , 271 , False).1 into the Condition box. (FIGURE 3)
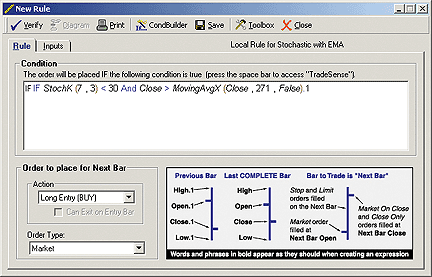
(4) Set the Order to place for Next Bar Action to Long Entry (BUY),
and the Order Type to Market.
(5) Click the Verify button.
(6) Click the Save button and type Long Entry Buy for the name of the
Rule then click Ok.
(7) Click the X in the upper right corner of the Rule editor window
to return to the New Strategy Window.
Long Exit Sell
(1) Click on the New Rule button.
(2) You will be asked if you would like to use the Condition Builder.
In this case click No. This will take you to the New Rule window.
(3) Type the formula IF StochK (7 , 3) > 70 Or Close < MovingAvgX
(Close , 271 , False).1 into the Condition box.
(4) Set the Order to place for Next Bar Action to Long Exit (SELL),
and the Order Type to Market.
(5) Click the Verify button.
(6) Click the Save button and type Long Exit Sell for the name of the
Rule then click Ok.
(7) Click the X in the upper right corner of the Rule editor window
to return to the New Strategy Window.
Short Entry Sell
(1) Click on the New Rule button.
(2) You will be asked if you would like to use the Condition Builder.
In this case click No. This will take you to the New Rule window.
(3) Type the formula IF StochK (7 , 3) > 70 Or Close < MovingAvgX
(Close , 271 , False).1 into the Condition box.
(4) Set the Order to place for Next Bar Action to Short Entry (SELL),
and the Order Type to Market.
(5) Click the Verify button.
(6) Click the Save button and type Short Entry Sell for the name of
the Rule then click Ok.
(7) Click the X in the upper right corner of the Rule editor window
to return to the New Strategy Window.
Short Exit Buy
(1) Click on the New Rule button.
(2) You will be asked if you would like to use the Condition Builder.
In this case click No. This will take you to the New Rule window.
(3) Type the formula IF StochK (7 , 3) < 30 And Close > MovingAvgX
(Close , 271 , False).1 into the Condition box.
(4) Set the Order to place for Next Bar Action to Short Exit (BUY),
and the Order Type to Market.
(5) Click the Verify button.
(6) Click the Save button and type Short Exit Buy for the name of the
Rule then click Ok.
(7) Click the X in the upper right corner of the Rule editor window
to return to the New Strategy Window.
Click on the Data tab and select the symbol that you wish to run the strategy on, in this case SP-067. (This can be changed to a different symbol later.)
To save your new strategy click the Save button and type Stochastic with EMA for the name of the Strategy, then click the Ok button.
Now that you have saved your new strategy, you can run the strategy by clicking the Run button. This will bring up the Performance Reports for this strategy.
You can check to see if there is an order to place for the next bar by clicking the Orders button. This will bring up the Orders for Next Bar report.
Another way to use your new Strategy in Trade Navigator Platinum is to apply it to a chart to visually see where the trades were placed over the history of the chart. To do this:
(1) Click on the chart.
(2) Type the letter A.
(3) Click on the Strategies tab and double click the name of the strategy
in the list.
You can also view the Orders for next bar report from a chart that the strategy is applied to by clicking the Orders for the next bar button on the toolbar.
For your convenience, Genesis Financial Technologies has created a special file that will add Robert Colby's "Stochastics With Long-Term Ema Filter" strategy and rules to Trade Navigator for you. Simply download the free special file "SC1206" from within Trade Navigator and follow the upgrade prompts.
--Michael Herman
Genesis Financial Technologies
https://www.GenesisFT.com