Access to foreign exchange trading has opened up exciting trading options for the retail trader. You can now trade alongside corporations and institutions in a highly liquid market that is global, traded around the clock, and highly leveraged. Before jumping into this market, however, we must understand the factors that affect the forex market. With that in mind, Stocks & Commodities has introduced Forex Focus to better prepare the retail trader to participate in the currency market.
Relative Spread Strength As A Long-Term Cyclic Tool
Having a hard time identifying cycle peaks? This indicator can help confirm cycle highs and lows.
by Ian Copsey
I use time cycles within my analysis a great deal, but one of the common problems in doing so is identifying cycle peaks. So I set out to create an indicator that could be used as a proxy for cycle highs and also help confirm cycle lows.
The indicator I ended up with is quite simple, simply measuring the relative strength index (RSI) of the spread between two simple moving averages. This is why I refer to it as the relative spread strength (RSS). The objective was to record the strength of the expansion of the spread that occurs in a move in one direction and then record the contraction as the market corrects, causing the moving averages to move back toward each other.
WHAT IS THE RELATIVE SPREAD STRENGTH?
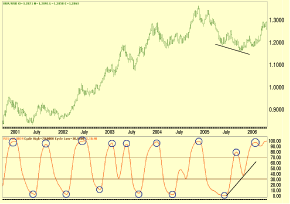
The indicator is simply a measure of the difference between the two averages--very simply, measure the difference between the two averages by taking the value of the longer moving average from the shorter moving average. You then put the result through the RSI formula and smooth the result with another average. See Figure 1 for the application.

FIGURE 1: RELATIVE SPREAD STRENGTH. Note how the price levels correlated with the oversold and overbought levels of the RSS.
See how every extreme occurred when RSS has either dropped below 30 or risen above 70. This is quite common and works well with longer-term charts, especially weekly charts. Divergences do form as occurred at the 1.1640 low in November 2005, and this strengthens the signal.
Readings above 70 or below 30 merely identify the potential for price to reverse and should not be taken as a trade signal. When an extreme is made, you should study the lower time frame to look for a trade signal. The trade signal could be a break in the trendline or confirmation of a reversal pattern.
...Continued in the October issue of Technical Analysis of STOCKS & COMMODITIES
Return to October 2006 Contents
Originally published in the October 2006 issue of Technical Analysis
of STOCKS & COMMODITIES magazine. All rights reserved.
© Copyright 2006, Technical Analysis, Inc.