Chart Analysis
Trying to anticipate market support and resistance requires practice and knowing a few rules. Let's take a look at the QQQQs. First, it's obvious from Figure 1 that at this point, the QQQQs are in a downtrend or at the very least a downswing, especially if you apply zigzag. Zigzag (red line going through price chart) helps you see only the "significant" movement while eliminating the noise. In this case, noise was defined to be any price movement less than 2%, while 2% was deemed significant. I used the open prices because visually it looks correct to me and that's what I want from zigzag -- a visual cue.
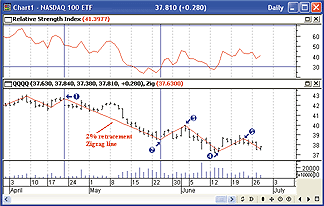
FIGURE 1: DAILY QQQQs WITH 14-PERIOD RSI. The two vertical lines identify a strong downswing, but despite the move down, RSI (top subchart) still doesn't hit zero. The red lines going through the price chart shows a zigzag connecting open with a minimum 2% price change. Points 1, 3, and 5 illustrate lower highs, while points 2 and 4, lower lows. All point to a downswing.
With the strong downward move between points 1 and 2, you might think that the relative strength index (RSI) would surely bottom out. RSI, which uses the ratio of up days to down days, in this case over the last 14 trading days, gets close when it reaches 23.8. What's the deal? The deal is that when you look at statistics of up and down days, the market tries to strike a balance. It also has a lot fewer sequences of three down days in a row than two down days in a row. Similarly, for up days there are still fewer four days in a row than three, and so forth. This explains why stochastic RSI is a better indicator in many aspects.
In addition, note that point 2 is lower than point 1, and that point 4 is lower than point 2-lower lows. Further, points 3 and 5 are lower highs. But let's get to the good stuff and get rid of RSI.
The first step is to ask, "Is a distribution taking place?" To find out, I built a simple indicator that allows me to compare current volume with past volume. I chose the 30-day simple moving average (SMA) and I started the second SMA 15 days after the first one started. The result, Figure 2, says we are in a distribution. Could we have anticipated the turning points?
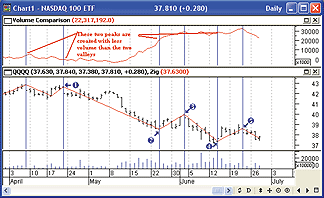
FIGURE 2: DAILY QQQQs WITH VOLUME COMPARISON. On the top subchart, vertical blue lines identify QQQQ price peaks on lowered volume versus valleys on higher volume, confirming a classical definition of distribution. The top subchart is a 30-day simple moving average of QQQQ volume minus a 30-day SMA of QQQQ's volume, but with the second SMA lagging the first by 15 days.
With a strong downswing, we have an opportunity to use a Fibonacci retracement. I wish I had remembered it when I first tried a trade with a limit bid, but I was looking for support in all the usual places. I doubt that small movements are going to be a good setup for Fibonacci retracements, and so, I only use them with moves like the one we are discussing.
MetaStock has nifty drawing tools that let you insert a Fibonacci retracement by just clicking on starting and ending points and then you can add to your lines. I needed an extension, and so I manually inserted -23.6%. You see the results in Figure 3 -- points 3, 4, and 5 all are predicted. Coincidences like this happen too often to be just chance. Right now, if the QQQQs break below 37.5, it looks like they are headed for the bottom of a channel defined by points 3 and 5 (upper portion of channel) with 2 and 4 (bottom portion).
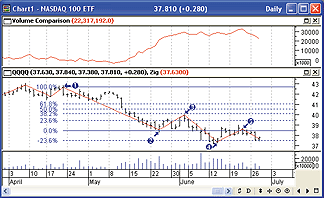
FIGURE 3: DAILY QQQQ WITH FIBONACCI RETRACEMENT. Points 1 and 2 are used as the range for zero percent to 100% and an extension of -23.6% is manually added. Point 3 matches up with 38.2%, point 4 with -23.6%, and point 5 with zero percent. Heck of a coincidence.
After the pause in interest rate hikes by the Federal Reserve, you see a pop in price. Price broke three Fibonacci levels, and it has coincidentally stopped at a Fibonacci level of -61.8 (Figure 4). But it gets more interesting when you add a Gann fan. From experience, I know that Gann fans only work when you have major to intermediate moves. I attached the fan at the peak and used a rise of -2 and a run of 22 to get an equal amount of rise versus run.
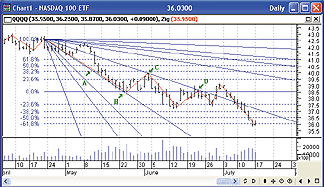
FIGURE 4: DAILY QQQ WITH GANN FAN AND FIBONACCI RETRACEMENTS. A red line defines peaks and valleys and is created using a 2% zigzag. The blue horizontal lines are Fibonacci retracement lines with extensions of -23.6, -38.2, -50.0, and -61.8 added on to cover continued downward price movement. The Gann fan is attached to the peak and is drawn using a rise of -2 and run of 22. Points A through D are events the Gann fan predicted.
The resulting fan is able to act as trend support and resistance by supporting the downward price move (point A), then predict price turning points B through D. It's more than just coincidence.
-Dennis D. Peterson, Staff Writer
Return to October 2006 Contents
Originally published in the October 2006 issue of Technical Analysis
of STOCKS & COMMODITIES magazine. All rights reserved.
© Copyright 2006, Technical Analysis, Inc.