September 2006
TRADERS' TIPS
You can copy these formulas and programs for easy use in your spreadsheet or analysis software. Simply "select" the desired text by highlighting as you would in any word processing program, then use your standard key command for copy or choose "copy" from the browser menu. The copied text can then be "pasted" into any open spreadsheet or other software by selecting an insertion point and executing a paste command. By toggling back and forth between an application window and the open Web page, data can be transferred with ease.
This month's tips include formulas and programs for:
![]() TRADESTATION: Adaptive Price Zone
TRADESTATION: Adaptive Price Zone
![]() METASTOCK: Adaptive Price Zone
METASTOCK: Adaptive Price Zone
![]() eSIGNAL: Adaptive Price Zone
eSIGNAL: Adaptive Price Zone
![]() AIQ: Adaptive Price Zone
AIQ: Adaptive Price Zone
![]() WEALTH-LAB: Adaptive Price Zone
WEALTH-LAB: Adaptive Price Zone
![]() AMIBROKER: Adaptive Price Zone
AMIBROKER: Adaptive Price Zone
![]() NEUROSHELL TRADER: Adaptive Price Zone
NEUROSHELL TRADER: Adaptive Price Zone
![]() INVESTOR/RT: Adaptive Price Zone
INVESTOR/RT: Adaptive Price Zone
![]() TRADING SOLUTIONS: Adaptive Price Zone
TRADING SOLUTIONS: Adaptive Price Zone
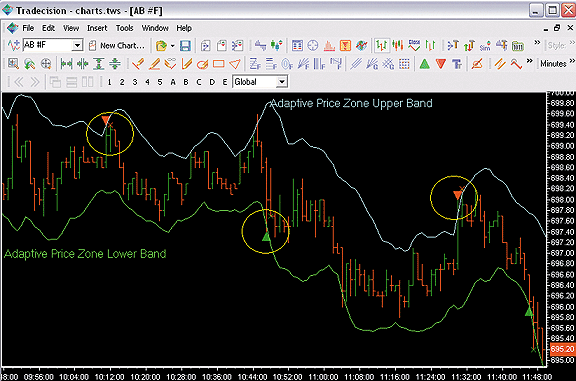
![]() TRADECISION: Adaptive Price Zone
TRADECISION: Adaptive Price Zone
![]() BIOCOMP DAKOTA: Adaptive Price Zone
BIOCOMP DAKOTA: Adaptive Price Zone
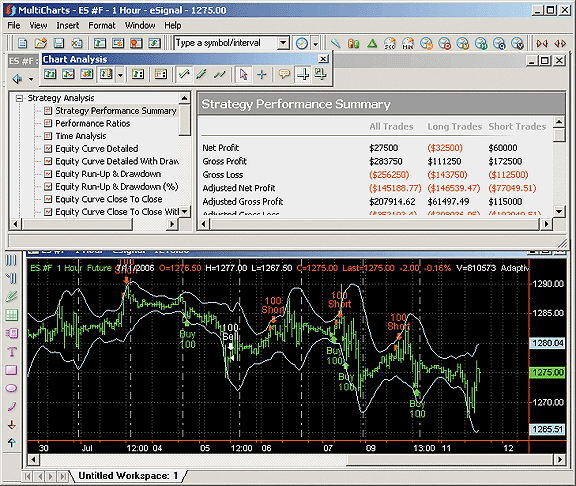
![]() MULTICHARTS: Adaptive Price Zone
MULTICHARTS: Adaptive Price Zone
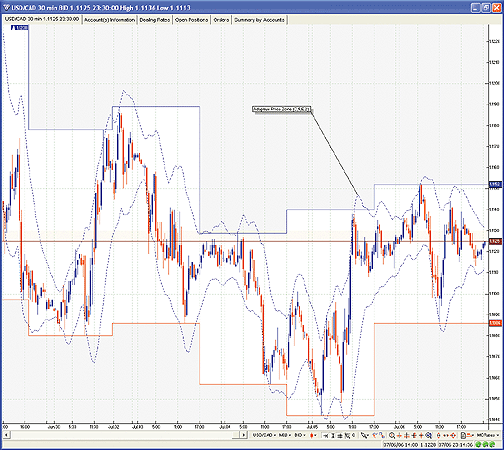
![]() VT TRADER: Adaptive Price Zone
VT TRADER: Adaptive Price Zone
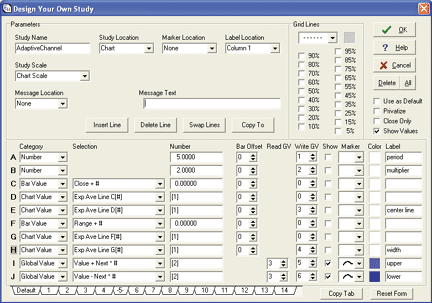
![]() ENSIGN WINDOWS: Adaptive Price Zone
ENSIGN WINDOWS: Adaptive Price Zone
TRADESTATION: Adaptive Price Zone
Lee Leibfarth's "Trading With An Adaptive Price Zone" provides an indicator and strategy for trading breakouts of a price zone that is defined by calculating the double-smoothed exponential moving average of price and the double-smoothed exponential average of the daily range.
His article already includes EasyLanguage code for performing these tasks in an indicator and strategy, both of which can be applied to a chart. Following is some EasyLanguage code to perform some of the strategy calculations in RadarScreen, a grid-type application that is part of the TradeStation platform. Terms like "buy," "sell," "sell short," and "buy to cover," which can be used only in chart-based strategies, have been replaced with variables and a function call. The function is named "RS_Trader."
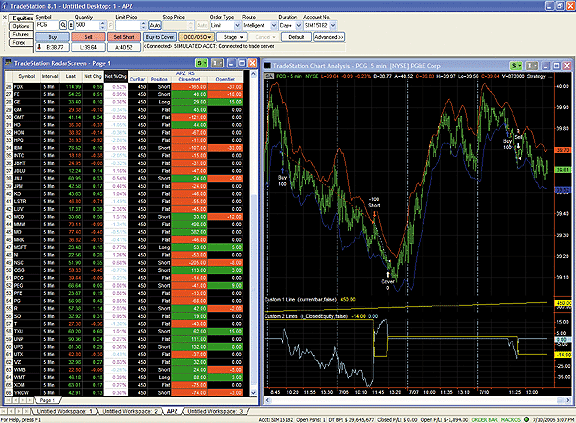
FIGURE 1: TRADESTATION AND RADARSCREEN, ADAPTIVE PRICE ZONE. Here is a sample five-minute chart of PCG. The RadarScreen (left) shows calculations for the APZ strategy. The linked chart of PCG (right) displays Leibfarth's APZ strategy applied. Subplot1 displays the CurrentBar for matching with RadarScreen's bar count. Subplot 2 displays strategy values for comparison with RadarScreen calculations.
Code for both this indicator and function can be found in the EasyLanguage
Library at TradeStation.com. To download this TradeStation code for this
concept, search for the file "Apz.eld."
Indicator:  APZ_RS
inputs:
 Price( Close ),
 Period( 20 ),
 BandPct( 1.4 ),
 ADXThreshold( 30 ) ;
variables:
 DSPrice( 0 ),
 DSRange( 0 ),
 PctBand( 0 ),
 UpBand( 0 ),
 DnBand( 0 ),
 ADXValue( 0 ),
 Action( "NA" ),
 Quantity( 100 ),
 RS_NetProfit( 0 ),
 RS_OpenPositionGain( 0 ),
  RS_MarketPosition( 0 ),
 MPString( "" ),
 RS_NetBGColor( 0 ),
 RS_OpenBGColor( 0 ) ;
DSPrice = Double_Smooth_EMA( Price, Period ) ;
DSRange = Double_Smooth_EMA( Range, Period ) ;
PctBand = BandPct * DSRange ;
UpBand = DSPrice + PctBand ;
DnBand = DSPrice - PctBand ;
ADXValue = ADX( 14 ) ;
if ADXValue <= ADXThreshold then
 begin
 if Low <= DnBand then
  Action = "Buy" ;
 if High >= UpBand then
  Action = "SellShort" ;
 end
else if ADXValue > ADXThreshold then
 if RS_MarketPosition = 1 then
  Action = "Sell"
 else
  Action = "BuyToCover" ;
RS_MarketPosition = RS_Trader( Action, Quantity,
 RS_NetProfit, RS_OpenPositionGain ) ;
if RS_MarketPosition = 1 then
 MPString = "Long"
else if RS_MarketPosition = -1 then
 MPString = "Short"
else
 MPString = "Flat" ;
if RS_NetProfit > 0 then
 RS_NetBGColor = DarkGreen
else if RS_NetProfit < 0 then
 RS_NetBGColor = Red
else
 RS_NetBGColor = Black ;
if RS_OpenPositionGain > 0 then
 RS_OpenBGColor = DarkGreen
else if RS_OpenPositionGain < 0 then
 RS_OpenBGColor = Red
else
 RS_OpenBGColor = Black ;
Plot1( CurrentBar, "CurrBar" ) ;
Plot2( MPString, "Position" ) ;
Plot3( RS_NetProfit, "ClosedNet" ) ;
Plot4( RS_OpenPositionGain, "OpenNet" ) ;
SetPlotBGColor( 3, RS_NetBGColor ) ;
SetPlotBGColor( 4, RS_OpenBGColor ) ;
Function:  RS_Trader
inputs:
 Action( stringsimple ),
 Quantity( numericsimple ),
 RS_NetProfit( numericref ),
 RS_OpenPositionGain( numericref ) ;
variables:
 ActionStr( "" ),
 PriorAction( "" ),
 LCPriorAct( "" ),
 OpenPriceChg( 0 ),
 NetPriceChg( 0 ),
 OpenChg( 0 ),
 NetChg( 0 ),
 RS_MarketPosition( 0 ),
 RS_EntryPrice( 0 ),
 RS_EntryDate( 0 ),
 RS_EntryTime( 0 ) ;
ActionStr = Action ;
PriorAction = ActionStr[1] ;
LCPriorAct = LowerStr( PriorAction ) ;
OpenPriceChg = Close - RS_EntryPrice ;
NetPriceChg = RS_EntryPrice - Open ;
OpenChg = OpenPriceChg * Quantity ;
NetChg = NetPriceChg * Quantity ;
RS_MarketPosition = RS_Trader[1] ;
if "buy" = LCPriorAct or "sellshort" = LCPriorAct then
 begin
 { going long from flat }
 if "buy" = LCPriorAct and RS_MarketPosition = 0 then
  begin
  RS_OpenPositionGain = OpenChg ;
  RS_Trader = 1 ;
  end
 { going long from short }
 else if "buy" = LCPriorAct and
  RS_MarketPosition = -1 then
  begin
  RS_NetProfit = RS_NetProfit + NetChg ;
  RS_OpenPositionGain = OpenChg ;
  RS_Trader = 1 ;
  end
 { going short from flat }
 else if "sellshort" = LCPriorAct and
  RS_MarketPosition = 0 then
  begin
  RS_OpenPositionGain = Neg( OpenChg ) ;
  RS_Trader = -1 ;
  end
 { going short from long }
 else if "sellshort" = LCPriorAct and
  RS_MarketPosition = 1 then
  begin
  RS_NetProfit = RS_NetProfit - NetChg ;
  RS_OpenPositionGain = Neg( OpenChg ) ;
  RS_Trader = -1 ;
  end ;
 RS_EntryPrice = Open ;
 RS_EntryDate = Date ;
 RS_EntryTime = Time ;
 end
else if "sell" = LCPriorAct or "buytocover" = LCPriorAct
 then
 begin
 { going from long to flat }
 if "sell" = LCPriorAct and RS_MarketPosition = 1
  then
  begin
  RS_NetProfit = RS_NetProfit - NetChg ;
  RS_OpenPositionGain = 0 ;
  RS_Trader = 0 ;
  end
 { going from short to flat }
 else if "buytocover" = LCPriorAct and
  RS_MarketPosition = -1 then
  begin
  RS_NetProfit = RS_NetProfit + NetChg ;
  RS_OpenPositionGain = 0 ;
  RS_Trader = 0 ;
  end ;
 RS_EntryPrice = 0 ;
 RS_EntryDate = 0 ;
 RS_EntryTime = 0 ;
 end
else if "buy" <> LCPriorAct
 and "sell" <> LCPriorAct
 and "sellshort" <> LCPriorAct
 and "buytocover" <> LCPriorAct
then
 begin
 if RS_MarketPosition = 1 then
  RS_OpenPositionGain = OpenChg ;
 if RS_MarketPosition = -1 then
  RS_OpenPositionGain = Neg( OpenChg ) ;
 end
else
 RS_Trader = RS_Trader[1] ;
--Mark MillsGO BACK
TradeStation Securities, Inc.
A subsidiary of TradeStation Group, Inc.
www.TradeStationWorld.com
METASTOCK: Adaptive Price Zone
Lee Leibfarth's article, "Trading With An Adaptive Price Zone," introduces
a new indicator and suggests a trading system for it. The formula for the
indicator and the instructions on adding it to MetaStock follow.
To enter these indicators into MetaStock:
1. In the Tools menu, select Indicator Builder.
2. Click New to open the Indicator Editor for a new indicator.
3. Type the name of the formula
4. Click in the larger window and type in the formula.
5. Click Ok to close the Indicator Editor.
Name: Instantaneous Trendline
Formula:
x:=Input("time periods", 2, 200, 20);
y:=Input("band percentage",0.1, 50, 1.4);
dsema:=Mov(Mov(C,x,E),x,E);
shift:=Mov(Mov(H-L,x,E),x,E);
dsema+(y*shift);
dsema-(y*shift);
This indicator will prompt for the time periods and the percentage shift of the bands. The
suggested trading system and instructions for creating it in MetaStock are:

1. Select Tools > the Enhanced System Tester
2. Click "New"
3. Enter the name, "Adaptive Price Zone Strategy"
4. Select the Buy Order tab and enter the following formula:
x:=20;
y:= 1.4;
dsema:=Mov(Mov(C,x,E),x,E);
shift:=Mov(Mov(H-L,x,E),x,E);
top:=dsema+(y*shift);
bot:=dsema-(y*shift);
ADX(14) < 30 AND L<bot
Select the "Sell" order tab and enter the following formula:
x:=20;
y:= 1.4;
dsema:=Mov(Mov(C,x,E),x,E);
shift:=Mov(Mov(H-L,x,E),x,E);
top:=dsema+(y*shift);
bot:=dsema-(y*shift);
ADX(14) >= 30 OR H>top
Select the "Sell short" order tab and enter the following formula:
x:=20;
y:= 1.4;
dsema:=Mov(Mov(C,x,E),x,E);
shift:=Mov(Mov(H-L,x,E),x,E);
top:=dsema+(y*shift);
bot:=dsema-(y*shift);
ADX(14) < 30 AND H>top
Select the "Buy to cover" order tab and enter this formula:
x:=20;
y:= 1.4;
dsema:=Mov(Mov(C,x,E),x,E);
shift:=Mov(Mov(H-L,x,E),x,E);
top:=dsema+(y*shift);
bot:=dsema-(y*shift);
ADX(14) >= 30 OR L<bot
Click OK to close the system editor.
--William Golson
Equis International
eSIGNAL: Adaptive Price Zone
For this month's Traders' Tips article by Lee Leibfarth, "Trading With An Adaptive Price Zone," we've provided two formulas: "AdaptivePriceZone.efs" and "Apz_Strategy.efs."
Both studies contain formula parameters for the period length and band percentage that may be configured through the Edit Studies option in the Advanced Chart. Apz_Strategy.efs has additional formula parameters for the ADX and its corresponding threshold value. The strategy study is compatible for backtesting and real-time usage.
A sample implementation is shown in Figures 2 and 3. To discuss this
study or download a complete copy of the formula, please visit the EFS
Library Discussion Board forum under the Bulletin Boards link at www.esignalcentral.com.
/***************************************
Provided By : eSignal (c) Copyright 2006
Description:  Trading With An Adaptive Price Zone
              by Lee Leibfarth
Version 1.0  07/06/2006
Notes:
* Sept 2006 Issue of Stocks and Commodities Magazine
* Study requires version 8.0 or higher.
Formula Parameters:                 Defaults:
Period                              20
Band Percent                        2
***************************************/
function preMain() {
    setPriceStudy(true);
    setStudyTitle("Adaptive Price Zone Indicator ");
    setCursorLabelName("Upper Band", 0);
    setCursorLabelName("Lower Band", 1);
    setDefaultBarThickness(2, 0);
    setDefaultBarThickness(2, 1);
    setDefaultBarStyle(PS_DOT, 0);
    setDefaultBarStyle(PS_DOT, 1);

    var fp1 = new FunctionParameter("nPeriods", FunctionParameter.NUMBER);
        fp1.setName("Period");
        fp1.setLowerLimit(1);
        fp1.setDefault(20);
    var fp2 = new FunctionParameter("nBandPct", FunctionParameter.NUMBER);
        fp2.setName("Band Percent");
        fp2.setLowerLimit(0);
        fp2.setDefault(2);
}
var bVersion = null;
var bInit = false;
var xAPZ = null;
var xAPZ_Upper = null;  // Upper Band
var xAPZ_Lower = null;  // Lower Band
function main(nPeriods, nBandPct) {
    if (bVersion == null) bVersion = verify();
    if (bVersion == false) return;
    if (bInit == false) {
        xAPZ = efsInternal("calcAPZ", nPeriods, nBandPct);
        bInit = true;
    }

    if (xAPZ_Upper == null) xAPZ_Upper = getSeries(xAPZ, 0);  // Upper Band
    if (xAPZ_Lower == null) var xAPZ_Lower = getSeries(xAPZ, 1);  // Lower Band
    var nAPZ_Upper = xAPZ_Upper.getValue(0);
    var nAPZ_Lower = xAPZ_Lower.getValue(0);
    if (nAPZ_Upper == null || nAPZ_Lower == null) return;
    if (high(0) > nAPZ_Upper) {
        drawShape(Shape.CIRCLE, AboveBar1, Color.blue, rawtime(0));
    } else if (low(0) < nAPZ_Lower) {
        drawShape(Shape.CIRCLE, BelowBar1, Color.blue, rawtime(0));
    }

    return new Array(nAPZ_Upper, nAPZ_Lower);
}
var xHL = null;
function calcAPZ(nPeriods, nBandPct) {
    if (xHL == null) xHL = efsInternal("calcHL");
    if (isNaN(xHL.getValue(0))) return;

    //nPeriods = Math.round(Math.sqrt(nPeriods));
    nPeriods = Math.ceil(Math.sqrt(nPeriods));
    var Value1 = ema(nPeriods, ema(nPeriods), 0);
    var Value2 = ema(nPeriods, ema(nPeriods, xHL), 0);
    if (Value1 == null || Value2 == null) return;

    var UpBand = nBandPct * Value2 + Value1;
    var DnBand = Value1 - nBandPct * Value2;
    if (UpBand == null || DnBand == null) return;

    return new Array(UpBand, DnBand);
}
function calcHL() {
    return high(0) - low(0);
}
function verify() {
    var b = false;
    if (getBuildNumber() < 779) {
        drawTextAbsolute(5, 35, "This study requires version 8.0 or later.",
            Color.white, Color.blue, Text.RELATIVETOBOTTOM|Text.RELATIVETOLEFT|Text.BOLD|Text.LEFT,
            null, 13, "error");
        drawTextAbsolute(5, 20, "Click HERE to upgrade.@URL=https://www.esignal.com/download/default.asp",
            Color.white, Color.blue, Text.RELATIVETOBOTTOM|Text.RELATIVETOLEFT|Text.BOLD|Text.LEFT,
            null, 13, "upgrade");
        return b;
    } else {
        b = true;
    }

    return b;
}
/***************************************
Provided By : eSignal (c) Copyright 2006
Description:  Trading With An Adaptive Price Zone
              by Lee Leibfarth
Version 1.0  07/06/2006
Notes:
* Sept 2006 Issue of Stocks and Commodities Magazine
* Study requires version 8.0 or higher.
* Study is designed for Back Testing.
Formula Parameters:                 Defaults:
Period                              20
Band Percent                        2
ADX Period                          14
ADX Smoothing                       14
ADX Threshold                       30
***************************************/
function preMain() {
    setPriceStudy(true);
    setStudyTitle("Adaptive Price Zone Strategy ");
    setShowTitleParameters(false);
    setCursorLabelName("Upper Band", 0);
    setCursorLabelName("Lower Band", 1);
    setCursorLabelName("ADX", 2);
    setDefaultBarFgColor(Color.blue, 0);
    setDefaultBarFgColor(Color.blue, 1);
    setDefaultBarFgColor(Color.green, 2);
    setDefaultBarThickness(2, 0);
    setDefaultBarThickness(2, 1);
    setDefaultBarStyle(PS_DOT, 0);
    setDefaultBarStyle(PS_DOT, 1);
    setDefaultFont("Ariel", 12);

    var fp1 = new FunctionParameter("nPeriods", FunctionParameter.NUMBER);
        fp1.setName("Period");
        fp1.setLowerLimit(1);
        fp1.setDefault(20);
    var fp2 = new FunctionParameter("nBandPct", FunctionParameter.NUMBER);
        fp2.setName("Band Percent");
        fp2.setLowerLimit(0);
        fp2.setDefault(2);
    var fp3 = new FunctionParameter("nADXPeriods", FunctionParameter.NUMBER);
        fp3.setName("ADX Period");
        fp3.setLowerLimit(1);
        fp3.setDefault(14);
    var fp4 = new FunctionParameter("nADXSmoothing", FunctionParameter.NUMBER);
        fp4.setName("ADX Smoothing");
        fp4.setLowerLimit(1);
        fp4.setDefault(14);
    var fp5 = new FunctionParameter("nADXThreshold", FunctionParameter.NUMBER);
        fp5.setName("ADX Threshold");
        fp5.setLowerLimit(0);
        fp5.setDefault(30);
}
var bVersion = null;
var bInit = false;
var bBackTest = true;
var vPosition = null;
var xAPZ = null;
var xAPZ_Upper = null;  // Upper Band
var xAPZ_Lower = null;  // Lower Band
function main(nPeriods, nBandPct, nADXPeriods, nADXSmoothing, nADXThreshold) {
    if (bVersion == null) bVersion = verify();
    if (bVersion == false) return;
    if (bInit == false) {
        xAPZ = efsInternal("calcAPZ", nPeriods, nBandPct);
        bInit = true;
    }

    if (xAPZ_Upper == null) xAPZ_Upper = getSeries(xAPZ, 0);  // Upper Band
    if (xAPZ_Lower == null) var xAPZ_Lower = getSeries(xAPZ, 1);  // Lower Band
    var nAPZ_Upper = xAPZ_Upper.getValue(0);
    var nAPZ_Lower = xAPZ_Lower.getValue(0);
    var nAPZ_Upper_1 = xAPZ_Upper.getValue(-1);
    var nAPZ_Lower_1 = xAPZ_Lower.getValue(-1);
    var nADX_0 = adx(nADXPeriods, nADXSmoothing, 0);
    var nADX_1 = adx(nADXPeriods, nADXSmoothing, -1);
    if (nAPZ_Upper_1 == null || nAPZ_Lower_1 == null || nADX_1 == null) return;
    if (getCurrentBarIndex() == 0) bBackTest = false;

    if (vPosition != null && nADX_1 > nADXThreshold) {  // Exit signal
        if (vPosition == "long") {
            drawText("Sell", AboveBar3, Color.red, Text.BOLD|Text.CENTER, "t"+rawtime(0));
            drawShape(Shape.DOWNARROW, AboveBar2, Color.red, "s"+rawtime(0));
            vPosition = null;
            Alert.playSound("ding.wav");
            if (bBackTest == true) {
                Strategy.doSell("Sell", Strategy.MARKET, Strategy.THISBAR);
            }
        } else if (vPosition == "short") {
            drawText("Cover", BelowBar3, Color.red, Text.BOLD|Text.CENTER, "t"+rawtime(0));
            drawShape(Shape.UPARROW, BelowBar2, Color.red, "s"+rawtime(0));
            vPosition = null;
            Alert.playSound("ding.wav");
            if (bBackTest == true) {
                Strategy.doCover("Cover", Strategy.MARKET, Strategy.THISBAR);
            }
        }
    } else if (nADX_1 <= nADXThreshold) {  // Entry signal

        if (vPosition != "short" && high(-1) >= nAPZ_Upper_1) { // Short signal
            vPosition = "short";
            drawText("Short", AboveBar3, Color.blue, Text.BOLD|Text.CENTER, "t"+rawtime(0));
            drawShape(Shape.DOWNARROW, AboveBar2, Color.blue, "s"+rawtime(0));
            Alert.playSound("pop.wav");
            if (bBackTest == true) {
                Strategy.doShort("Short", Strategy.MARKET, Strategy.THISBAR);
            }
        }
        if (vPosition != "long" && low(-1) <= nAPZ_Lower_1) { // Long signal
            vPosition = "long";
            drawText("Long", BelowBar3, Color.blue, Text.BOLD|Text.CENTER, "t"+rawtime(0));
            drawShape(Shape.UPARROW, BelowBar2, Color.blue, "s"+rawtime(0));
            Alert.playSound("pop.wav");
            if (bBackTest == true) {
                Strategy.doLong("Long", Strategy.MARKET, Strategy.THISBAR);
            }
        }
    }

    return new Array(nAPZ_Upper, nAPZ_Lower, nADX_0.toFixed(6));
}
var xHL = null;
function calcAPZ(nPeriods, nBandPct) {
    if (xHL == null) xHL = efsInternal("calcHL");
    if (isNaN(xHL.getValue(0))) return;

    //nPeriods = Math.round(Math.sqrt(nPeriods));
    nPeriods = Math.ceil(Math.sqrt(nPeriods));
    var Value1 = ema(nPeriods, ema(nPeriods), 0);
    var Value2 = ema(nPeriods, ema(nPeriods, xHL), 0);
    if (Value1 == null || Value2 == null) return;

    var UpBand = nBandPct * Value2 + Value1;
    var DnBand = Value1 - nBandPct * Value2;
    if (UpBand == null || DnBand == null) return;

    return new Array(UpBand, DnBand);
}
function calcHL() {
    return high(0) - low(0);
}
function verify() {
    var b = false;
    if (getBuildNumber() < 779) {
        drawTextAbsolute(5, 35, "This study requires version 8.0 or later.",
            Color.white, Color.blue, Text.RELATIVETOBOTTOM|Text.RELATIVETOLEFT|Text.BOLD|Text.LEFT,
            null, 13, "error");
        drawTextAbsolute(5, 20, "Click HERE to upgrade.@URL=https://www.esignal.com/download/default.asp",
            Color.white, Color.blue, Text.RELATIVETOBOTTOM|Text.RELATIVETOLEFT|Text.BOLD|Text.LEFT,
            null, 13, "upgrade");
        return b;
    } else {
        b = true;
    }

    return b;
}
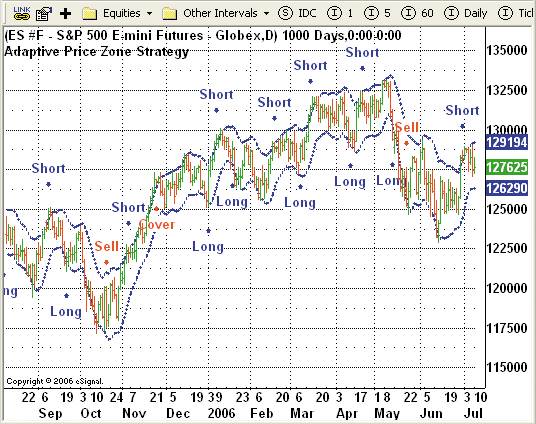
FIGURE 2: eSIGNAL, ADAPTIVE PRICE ZONE INDICATOR. Here is a demonstration of Lee Leibfarth's adaptive price zone indicator on the S&P 500 emini futures contract in eSignal.
FIGURE 3: eSIGNAL, ADAPTIVE PRICE ZONE STRATEGY. Here is a demonstration of Lee Leibfarth's adaptive price zone system on the S&P 500 emini futures contract in eSignal.
--Jason Keck
eSignal, a division of Interactive Data Corp.
800 815-8256, www.esignalcentral.com
AIQ: Adaptive Price Zone
Here is the AIQ code for Lee Leibfarth's adaptive price zone indicator and the related trading system.
Since AIQ is well suited to simulate trading a portfolio of stocks, I tested the system on the NASDAQ 100 list of stocks using the Portfolio Manager. I did a rough optimization on the long side of the trading system using the bullish period from 10/15/2002 to 7/11/2006. I used the ADX value descending to pick three trades per day, 10% each, and a maximum of 10 open positions. The results of the first test show that the long side of the system outperforms the NASDAQ 100 index (see Figure 4, which shows an average return of 28.7% with a Sharpe ratio of 1.35).
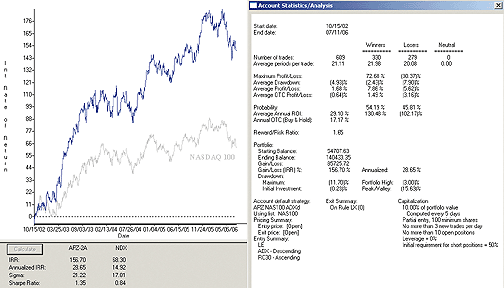
FIGURE 4: AIQ SYSTEMS, ADAPTIVE PRICE ZONE. Testing the APZ strategy on the long side during a bullish period produced good results, outperforming the NASDAQ 100 index and having an average return of 28.7% with a Sharpe ratio of 1.35.
I then tested the short side, using the parameters from the first
test, over the bearish period 9/01/2000 to 10/15/2002 and again, the short
side outperformed the NASDAQ 100 index (see Figure 5, which shows an average
return of 36.3% with a Sharpe ratio of 1.07). However, neither the long
nor the short side of the system performed well when the test periods were
reversed. The long side, when tested during the bearish period from 9/01/2000
to 10/15/2002, showed an average loss of 22.4% with a Sharpe ratio of -0.58.
The short side, when tested during the bullish period from 10/15/2002 to
07/11/2006, showed an average loss of 24.6% with a Sharpe ratio of -1.24.
Before trading this system on stocks, it appears that a market-timing filter
should be added.
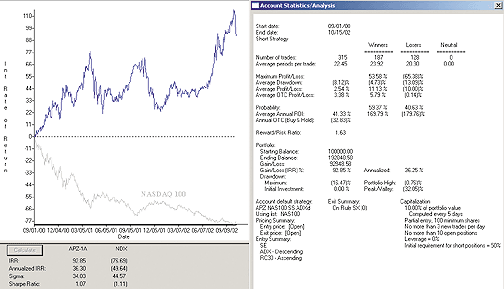
FIGURE 5: AIQ SYSTEMS, ADAPTIVE PRICE ZONE. Testing the APZ strategy on the short side during a bearish period also produced good results, outperforming the NASDAQ 100 index and having an average return of 36.3% with a Sharpe ratio of 1.07.
This code can be downloaded from the AIQ website at www.aiqsystems.com.
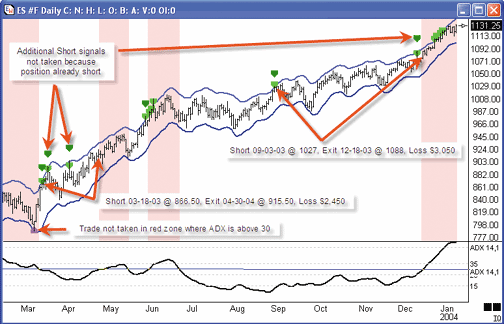
!! TRADING WITH AN ADAPTIVE PRICE ZONE
!  Author: Lee Leibfarth, TASC September, 2006
!  Coded by: Richard Denning 07/06/06
! CODING ABBREVIATIONS:
H is [high].
L is [low].
C is [close].
Price is C.
LL1 is 65.
BB1 is 1.8.
PP1 is round(sqrt(LL1)).
dsEMA is expavg(expavg(Price,PP1),PP1).
RdsEMA is expavg(expavg(H - L,PP1),PP1).
UpAPZ is dsEMA + BB1 * RdsEMA.
DnAPZ is dsEMA - BB1 * RdsEMA.
! COLOR BAR STUDY
Green if L <= DnAPZ and [ADX] < 30.
Red if H >= UpAPZ and [ADX] < 30.
! TRADING SYSTEM
ADXco is 30.
! Note: set ADX value to default of 14.
LE if [ADX] <= ADXco and L <= DnAPZ.
LX if  [ADX] > ADXco or H >= UpAPZ.
SE if [ADX] <= ADXco and H >= UpAPZ.
SX if  [ADX] > ADXco or L <= DnAPZ.
! RANKING
ADX is [ADX].
RC30 is (C / valresult(C,30) - 1) * 100.
--Richard Denning
AIQ Systems, www.aiqsystems.com
richard.denning@earthlink.net
WEALTH-LAB: Adaptive Price Zone
Here is the WealthScript code necessary to recreate the adaptive price zone as well as a testing strategy based on the ideas expressed in Lee Leibfarth's article in this issue.
As suggested in the article, we included an additional exit if the trade turns unprofitable after three bars. To detect if the ADX is moving up or down, we felt it necessary to add a two-pole Gaussian filter for smoothing. Finally, the script is "optimizer-ready" so that you can investigate how changing the default values for some variables can affect the profit outcome of the strategy. A sample chart is shown in Figure 6.
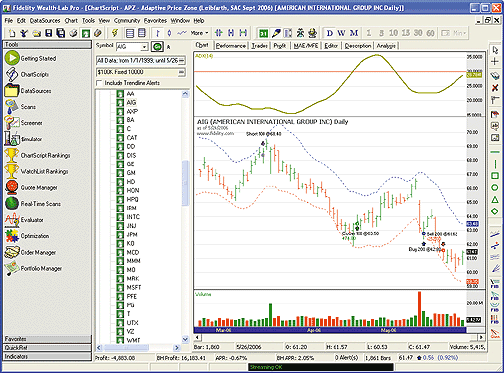
FIGURE 6: WEALTH-LAB, ADAPTIVE PRICE ZONE. We didn't find the strategy particularly profitable trading stocks on a daily basis, but some trades like the one shown here quite accurately catch the meaty part of a reversal.
WealthScript code:
{#OptVar1 20;10;50;5}
{#OptVar2 20;16;40;4}
{$I 'EMA2'}
{$I 'Gaussian'}
const ADX_Threshold = 30;
var Bar, p, dsEMA, dsAdapt, Uband, Lband, EMAPer, ADXPane, hADX: integer;
var BandPct: float;
var ExitSig: string;
EMAPer := #OptVar1;
BandPct := #OptVar2 / 10;
function dsEMASeries( Series, Period: integer ): integer;
begin
  var srPer: float = Sqrt( Period );
  Result := EMA2Series( EMA2Series( Series, srPer ), srPer );
end;
{ Create and plot indicator series }
dsEMA := dsEMASeries( #Close, EMAPer );
dsAdapt := dsEMASeries( SubtractSeries( #High, #Low ), EMAPer );
dsAdapt := MultiplySeriesValue( dsAdapt, BandPct );
Uband := AddSeries( dsEMA, dsAdapt );
Lband := SubtractSeries( dsEMA, dsAdapt );
SetDescription( UBand, 'Upper APZ' );
SetDescription( LBand, 'Lower APZ' );
PlotSeries( Uband, 0, #Blue, #Dotted );
PlotSeries( Lband, 0, #Red, #Dotted );
ADXPane := CreatePane( 75, true, true );
hADX := GaussianSeries( ADXSeries( 14 ), 13, 2 );
PlotSeriesLabel( hADX, ADXPane, 550, #Thick, 'ADX(14)' );
DrawHorzLine( ADX_Threshold, ADXPane, #Red, #Thin );
{ Execute trading system }
for Bar := EMAPer * 3 to BarCount - 1 do
begin
  if LastPositionActive then
  begin
    p := LastPosition;
    ExitSig := '';
    if ( Bar + 1 - PositionEntryBar( p ) > 3 )
    and ( PositionOpenProfitPct( Bar, p ) <= -1 ) then
      ExitSig := 'No Reversal'
    else if CrossOverValue( Bar, hADX, 30 ) then
      ExitSig := 'ADX Exit';
    if ExitSig <> '' then
      if PositionLong( p ) then
        SellAtMarket( Bar + 1, p, ExitSig )
      else
        CoverAtMarket( Bar + 1, p, ExitSig );
  end
  else if ( ROC( Bar, hADX, 2 ) < 0 ) and ( @hADX[Bar] < ADX_Threshold ) then
    if CrossUnder( Bar, #Low, LBand ) then
      BuyAtMarket( Bar + 1, '' )
    else if CrossOver( Bar, #High, UBand ) then
      ShortAtMarket( Bar + 1, '' );
end;
-- Robert SucherGO BACK
www.wealth-lab.com
AMIBROKER: Adaptive Price Zone
In "Trading With An Adaptive Price Zone," author Lee Leibfarth presents a trading technique that uses adaptive bands based on the double-smoothed exponential moving average and the classic ADX indicator.
Implementing the adaptive price zone technique using AmiBroker Formula Language is easy and straightforward. Listing 1 shows ready-to-use code. The formula is for both the indicator and the trading system. A sample chart is shown in Figure 7.
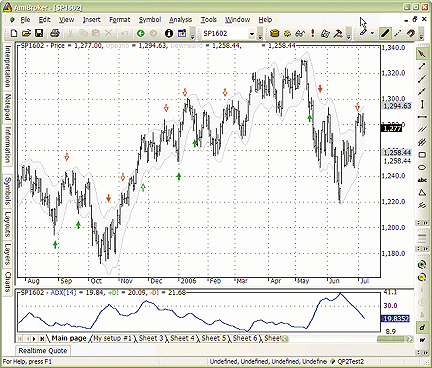
FIGURE 7: AMIBROKER, ADAPTIVE PRICE ZONE. This AmiBroker screenshot shows a daily price chart of the S&P 500 continuous contract with adaptive price zone bands and trade entry/exit arrows (upper pane) and the ADX indicator (lower pane).
LISTING 1
// Adaptive Price Zone Indicator & system
////////////////////////////////
function DblSmoothEMA( price, Length )
{
   period = IIf( Length < 0, 1, sqrt( Length ) );
   smooth = 2 / ( period + 1 );
   return AMA( AMA( price, smooth ), smooth );
}
price = ParamField("Price");
period = Param("period", 20, 2, 100 );
BandPct = Param("width[%]", 1.4, 0.1, 4, 0.1 );
DsEMA = DblSmoothEMA( price, period );
RangeDsEMA = DblSmoothEMA( H - L, period );
UpBand = BandPct * RangeDsEMA + DsEMA;
DnBand = DsEMA - BandPct * RangeDsEMA ;
Plot( C, "Price", colorBlack, styleBar );
Plot( UpBand , "UpBand", colorLightGrey );
Plot( DnBand , "DownBand", colorLightGrey );
// you may uncomment lines below to get 'cloud' chart
// if you are using version 4.80 or higher
// PlotOHLC( UpBand, UpBand, DnBand, DnBand, "Band",
// ColorRGB( 245,245,255), styleCloud );
SetTradeDelays( 1, 1, 1, 1 );
ADXThshold = 30;
ADXValue = ADX( 14 );
Buy = ADXValue <= ADXThshold AND Low <= DnBand;
Short = ADXValue <= ADXThshold AND High >= UpBand;
Sell = Cover = ADXValue > ADXThshold;
if( Status("action") == actionIndicator )
{
 Equity(2);
 PlotShapes( Buy * shapeUpArrow, colorGreen, 0, DnBand, -24 );
 PlotShapes( Sell * shapeDownArrow, colorRed, 0, UpBand, -24 );
 PlotShapes( Short * shapeHollowDownArrow, colorRed, 0, UpBand, -24 );
 PlotShapes( Cover * shapeHollowUpArrow, colorGreen, 0, DnBand, -24 );
}
--Tomasz Janeczko, AmiBroker.com
www.amibroker.com
NEUROSHELL TRADER: Adaptive Price Zone
The adaptive price zones described by Lee Leibfarth in his article in
this issue can be easily implemented in NeuroShell Trader by combining
a few of NeuroShell Trader's 800+ indicators. To implement the excursion
indicators, select "New Indicator ..." from the Insert menu and use the Indicator
Wizard to create the following indicators:
Upper Band:
     Add2 ( ExpAvg(ExpAvg(Close,4),4), Mult2( 1.4, ExpAvg(ExpAvg(Subtract(High,Low),4),4) ) )
Lower Band:
     Subtract ( ExpAvg(ExpAvg(Close,4),4), Mult2( 1.4, ExpAvg(ExpAvg(Subtract(High,Low),4),4) ) )
To recreate the adaptive price zone strategy, select "New Trading Strategy ..." from the Insert menu
and enter the following entry and exit conditions in the appropriate locations of the Trading
Strategy Wizard:

Generate a buy long MARKET order if ALL of the following are true:
 A<=B ( ADX(High, Low, Close, 14, 14), 30 )
 A<=B ( Low, LowerBand  )
Generate a sell long MARKET order if ALL of the following are true:
 A>B ( ADX(High, Low, Close, 14, 14), 30 )
Generate a sell short MARKET order if ALL of the following are true:
 A<=B ( ADX(High, Low, Close, 14, 14), 30 )
 A>=B ( Low, UpperBand  )
Generate a cover short MARKET order if ALL of the following are true:
 A>B ( ADX(High, Low, Close, 14, 14), 30 )
A sample chart is shown in Figure 8.
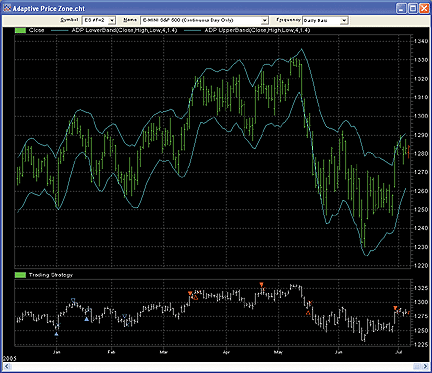
FIGURE 8: NEUROSHELL, ADAPTIVE PRICE ZONE. This sample NeuroShell Trader chart displays the trend adaptive price zone indicator and system.
If you have NeuroShell Trader Professional, you can also choose
whether the system parameters should be optimized. After backtesting the
trading strategy, use the "Detailed Analysis ..." button to view the backtest
and trade-by-trade statistics for the adaptive price zone trading system.
Users of NeuroShell Trader can go to the STOCKS & COMMODITIES section of the NeuroShell Trader free technical support website to download a copy of this or previous Traders' Tips.
--Marge Sherald, Ward Systems Group, Inc.GO BACK
301 662-7950, sales@wardsystems.com
www.neuroshell.com
INVESTOR/RT: Adaptive Price Zone
Figure 9 shows an Investor/RT implementation of Lee Leibfarth's adaptive price zone (APZ) bands on a one-minute chart of the S&P emini. The upper and lower bands are constructed using custom indicators with the following syntax:
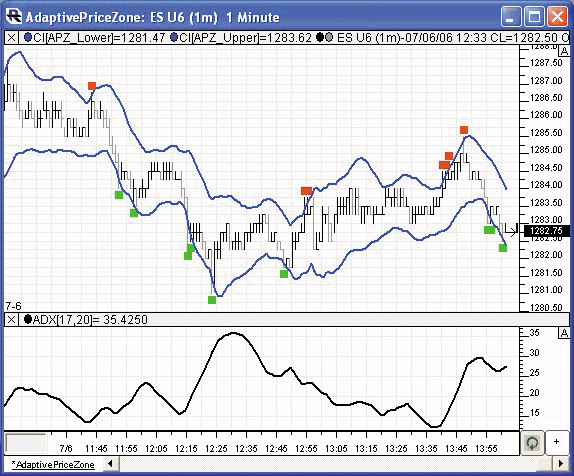
FIGURE 9: INVESTOR/RT, ADAPTIVE PRICE ZONE. This Investor/RT one-minute bar chart of ES U6 displays the APZ upper and lower bands in blue, along with signal markers when price drops below the lower band (buy) or rises above the upper band (sell).
APZ Upper Band
TRIP + 2 * TRIP_ATR
APZ Lower Band
TRIP - 2 * TRIP_ATR
The Trip token represents the triple smoothing indicator, but it
also has an option for double smoothing instead of triple smoothing.
This chart can be quickly imported into Investor/RT, along with the associated custom indicators and signal markers, by visiting the Investor/RT Charts page at the following URL: