Evolution Of An Indicator
The Wilson Relative Price Channel
by Leon Wilson
Several indicators quantify the relationship between price action and strength. Here's one adapted from the relative strength index.
For technical analysis to adapt and change, you as the trader must understand the environment in which you operate and be able to think about the strategies and tools to apply. Such analysis will allow your trading style to evolve and you will develop a deeper appreciation for market behavior. In order to do so, however, you need to question the source of information and the accepted practice of how to use the technique; you must learn to scrutinize information instead of accepting it at face value, regardless of where it may originate.
A VISIT WITH RSI
The most popular index, mainly because it's considered to be one of the most effective, would be the relative strength index (RSI). It is a range-bound index that defines the disparity that exists between higher and lower closing prices.
The conventional application of the RSI is to place it in a separate pane at the bottom of the screen. You then analyze the behavior and disparity associated with trending activity and the market's ability to shift the closing price in any direction. Assume that this alternative reflection of the closing price is not only consistent but also generally more beneficial over and above the raw data (the closing price). Although I use the RSI here, the same principles apply to similar range-bound indexes such as money flow, directional index, and relative volatility.
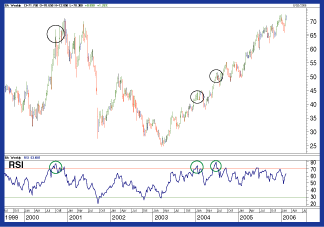
Let's look at an example. In Figure 1, which shows the chart of The Boeing Co. (BA), there are three areas of interest when it comes to the relationship between the trading price and the relative strength index. The closing price associated with the circled area on the left (September 1, 2000) is $64.75, while the circle in the middle (January 2, 2004) is $41.99. Finally, on the right side of the screen (June 4, 2004), BA finishes the week with a closing price of $46.90.

Figure 1: Price action & conventional relative strength index. The overbought regions of 70% are dynamic and only a reflection of one aspect that is part of a broader calculation. A relationship that is often overlooked is the one between range-bound indicators and price action. The impact of trading on unrelated scales defining value is seldom taken into consideration.
...Continued in the July issue of Technical Analysis of STOCKS
& COMMODITIES
Excerpted from an article originally published in the July 2006 issue of Technical Analysis of STOCKS & COMMODITIES magazine. All rights reserved. © Copyright 2006, Technical Analysis, Inc.
Return to July 2006 Contents