The Froth In The Market
The Power Of Implied Volatility
by Sam Bhugaloo
Do you trade beans, grains, softs, oil, or precious metals? Here’s a technique to predict market movements and price direction when trading futures and options on commodities.
Implied volatility can be used to predict whether a market is likely to move higher or lower and it can warn you against buying options that are too expensive. Implied volatility is a powerful tool and if used correctly, it will add another dimension to your trading and remove the element of guesswork. Unfortunately, many nonprofessional futures and options traders do not factor in implied volatility as part of their trading plan. Let me show you why they should.
HOW MUCH FROTH IS IN THIS GLASS OF BEER?
The mere mention of the term implied volatility (IV) tends to make an individual’s attention wander. The textbooks will state that implied volatility is a measure of the strike price and premium of an option in relation to the underlying futures price. It is in effect a measure of supply and demand for an option. This definition itself confuses the nonprofessional traders. I’ll show you how to simplify the technique and apply it through an analogy and series of charts.
Implied volatility is used to measure a market’s risk — or to simplify things, its “froth” content. What do I mean? Here’s an example. Jack went to his local bar and ordered a pint of beer and was served more froth than beer. Like many of us would be in the same situation, Jack was displeased. Unfortunately, this is exactly what most traders go through every day. Traders will buy options with more froth than beer, and when the froth evaporates, they are left with little or nothing. The return on their investment is zero. Understanding this concept alone will first stop you from buying options that are too expensive (that is, they have too much froth), and second, if you are a futures trader, will allow you to predict the direction of the market.
Options floor traders are considered the smart traders. They predominantly sell options to options buyers, therefore exposing themselves to unlimited risk. Their only gain is the premium they collect. They understand the markets and, by using implied volatility (the froth in the glass of beer), they ensure the odds are in their favor. Options traders determine their risks using sophisticated handheld devices to calculate the implied volatility along with some other esoteric and exotic calculations to come up with the options premium.
Fortunately, it’s not necessary to understand these calculations. You only need to be concerned with the implied volatility or “froth” element of the options premium. Many of us are more comfortable viewing graphs than visualizing mathematical calculations. Implied volatility can be understood by simply analyzing these readily available graphs. This is particularly useful for analyzing support and resistance areas.
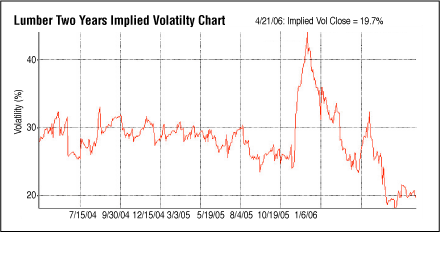
Let’s look at a two-year chart of implied volatility for lumber (Figure 1). The lines indicate how much froth there is in the lumber market. A higher implied volatility indicates that our pint of beer has a lot more froth, while a lower implied volatility indicates less froth. This is all you need to understand implied volatility when analyzing these graphs. The following examples will highlight how IV can be used to predict futures price direction in commodities trading.

Figure 1: Implied volatility, lumber. Here is a two-year chart
of implied volatility
indicating the level of froth in the market.
...Continued in the July issue of Technical Analysis of STOCKS
& COMMODITIES
Excerpted from an article originally published in the July 2006 issue of Technical Analysis of STOCKS & COMMODITIES magazine. All rights reserved. © Copyright 2006, Technical Analysis, Inc.
Return to July 2006 Contents