It Can Be Good, And It Can Be Bad
Playing The Yield Curve
by Jay Kaeppel
So what is the yield curve, and how can you use it in your trading? Find out here.
Most investors are at least vaguely aware of something known in financial circles as the "yield curve." In its most basic definition, the yield curve represents the difference between interest rates offered by US Treasury securities of various lengths of time until maturity. A more complex version of the yield curve compares intermediate-term interest rates to short-term rates and long-term rates to both intermediate- and short-term rates. Still, the most useful piece of information to find from the yield curve is how short-term rates compare to long-term ones, as these two values represent the two polar extremes on the yield curve. So for the purposes of this article, we will define the yield curve as the difference between long-term and short-term interest rates.
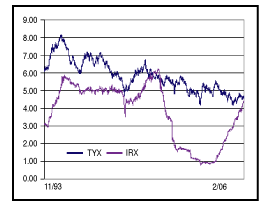
The simplest way to analyze the yield curve is to subtract the yield on 13-week T-bills from the yield on long-term Treasuries. This can be done using the ticker symbols $TYX and $IRX. $TYX represents the latest yield on long-term (30-year) Treasury bonds, while $IRX represents the latest yield on 13-week Treasury bills. These two yields are plotted against one another in Figure 1.

Figure 1: long-term and short-term interest rates (November 1993-February 2006). Here you see the 30-year Treasury bonds plotted against the 13-week Treasury bills.
BASIC INTERPRETATION
The most important piece of common wisdom among those who follow changes in the yield curve is that a negative yield curve is "a bad thing." This generalization applies both to the impact on the economy as well as to the implications for the stock market. Let's consider why this is perceived to be and, as it turns out, is in fact so.
When a person buys a Treasury bond, the greatest risks that he or she assumes are interest rate risk and inflation risk. If you buy a 30-year T-bond with a current annual yield of, say, 5%, your two greatest fears moving forward are:
...Continued in the June issue of Technical Analysis of STOCKS & COMMODITIES
Excerpted from an article originally published in the June 2006 issue of Technical Analysis of STOCKS & COMMODITIES magazine. All rights reserved. © Copyright 2006, Technical Analysis, Inc.
Return to June 2006 Contents