Access to foreign exchange trading has opened up exciting trading options for the retail trader. You can now trade alongside corporations and institutions in a highly liquid market that is global, traded around the clock, and highly leveraged. Before jumping into this market, however, we must understand the factors that affect the forex market. With that in mind, STOCKS& COMMODITIES has introduced Forex Focus to better prepare the retail trader to participate in the currency market.
BASIC STATISTICAL ANALYSIS: A TOOL FOR ALL TRADERS
What implications could these statistical studies have on the spot foreign exchange market?
Many of you look at charts. Many of you evaluate the fundamentals. But how many of you look at statistics? Granted, there is not a whole lot of glamour in what is often referred to as the quantitative analysis of the markets, but there certainly is the potential for value. In this article, you will find examples of studies that anyone can perform without much strain.
PRICE CHANGES AND DAILY RANGES
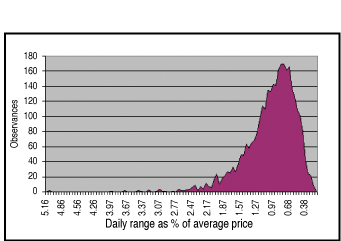
Pictures speak volumes, so it is worth looking at a couple of charts. Figure 1 is a distribution of the daily ranges in the exchange rate between the euro and the US dollar (EUR/USD). The ranges are calculated as a percentage of the day's average price (high plus low divided by two). There is a lot of purple to the right-hand side of the graph where the lowest values are located. A few sizable ranges were included (including one in excess of 5%), but in most observations the market held within a range of 1.5% or less.

FIGURE 1: Distribution of daily EUR/USD ranges (1999-2004). The price ranges stayed, for the most part, within a range of 1.5%.
To anyone familiar with the markets, this is hardly earth-shattering information. It tells you that the market tends to move in small increments and to experience fairly small ranges, but also on occasion it experiences significant volatility. You are not going to develop a trading system based on this analysis alone, but it can come in handy where risk management and trade expectations are concerned.
Figure 2 is a plot of the daily percent changes, again for EUR/USD. This is not the place to begin a discussion about the type of distribution displayed. The important fact to take away is that most of the time, EUR/USD moves inside 1% in either direction, often only a fraction of that. The largest moves were in excess of 2%, giving an idea of potential extreme risks on a daily basis.
Originally published in the December 2005 issue of Technical Analysis of STOCKS & COMMODITIES magazine. All rights reserved. © Copyright 2005, Technical Analysis, Inc.
Return to December 2005 Contents