July 2005
TRADERS' TIPS
You can copy these formulas and programs for easy use in your spreadsheet or analysis software. Simply "select" the desired text by highlighting as you would in any word processing program, then use your standard key command for copy or choose "copy" from the browser menu. The copied text can then be "pasted" into any open spreadsheet or other software by selecting an insertion point and executing a paste command. By toggling back and forth between an application window and the open Web page, data can be transferred with ease.
This month's tips include formulas and programs for:
TRADESTATION: Targeting Your Pattern
METASTOCK: Targeting Your Pattern
WEALTH-LAB: Targeting Your Pattern
AMIBROKER: Targeting Your Pattern
AMIBROKER: Something Darvas, Something New (ERRATA)
eSIGNAL: Targeting Your Pattern
INVESTOR/RT: Targeting Your Pattern
NEUROSHELL TRADER: Targeting Your Pattern
TRADING SOLUTIONS: Targeting Your Pattern
AIQ: Targeting Your Pattern
NEOTICKER: Targeting Your Pattern
SMARTRADER SOFTWARE: Targeting Your Pattern
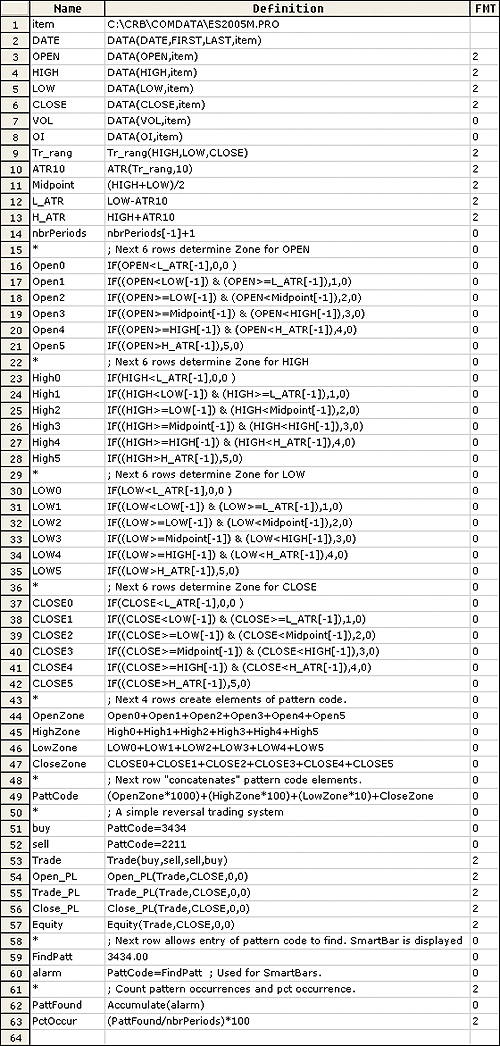
TECHNIFILTER PLUS: Targeting Your Pattern
or return to July 2005 Contents
TRADESTATION: Targeting Your Pattern
Massimiliano Scorpio's article in this issue, "Targeting Your Pattern," describes price bar patterns. Every price bar can be identified by its pattern. It can then be determined both how frequently a pattern occurs on a chart and how frequently the subsequent day closes higher than it did on the day on which the pattern occurred. The article provides code for identifying patterns within a chart, and muses about screening securities based on the patterns. This indicator code can be used in RadarScreen to screen securities based on Scorpio's patterns.

FIGURE 1: TRADESTATION, TARGETING YOUR PATTERN, NASDAQ 100 SCREEN. The right-most three RadarScreen columns show the end-of-bar pattern for each stock, the number of occurrences of that pattern in the last N bars (500 bars by default), and the number of times the bar following the pattern bar closed higher than the pattern bar.This code may be downloaded from the TradeStation Support Center, which is accessible from TradeStation.com. Look for the file "ScorpioPatterns.ELD."
Indicator: msPatt&Stat2
inputs:
 MinSamples( 9 ) ,
 PlotType( 1 ) ;
variables:
 Pattern( 0 ),
 UpDay( 0 ),
 LoopCounter( 0 ),
 Offset( 1 ),
 Location( 0 ),
 MyTest( 0 ),
 ReportLocation( 0 ) ;
arrays:
 PatternArray[]( 0 ),
 CountArray[]( 0 ),
 CountUpArray[]( 0 ) ;
Pattern = msRecognize ;
if Close > Open then
 UpDay = 1
else
 UpDay = 0 ;
if CurrentBar = 1 then
 begin
 Array_SetMaxIndex( PatternArray, 1 ) ;
 Array_SetMaxIndex( CountArray, 1 ) ;
 Array_SetMaxIndex( CountUpArray, 1 ) ;
 end ;
for LoopCounter = 0 to Offset
 begin
 if Pattern[1] = PatternArray[LoopCounter] then
  begin;
  CountArray[LoopCounter] =
   CountArray[LoopCounter] + 1 ;
  CountUpArray[LoopCounter] =
   CountUpArray[LoopCounter] + UpDay ;
  Location = LoopCounter ;
  LoopCounter = Offset + 1 ;
  end ;
 end ;
if LoopCounter <> Offset + 2 then
 begin
 Offset = Offset + 1 ;
 Array_SetMaxIndex( PatternArray, Offset ) ;
 Array_SetMaxIndex( CountArray, Offset ) ;
 Array_SetMaxIndex( CountUpArray, Offset ) ;
 PatternArray[Offset] = Pattern[1] ;
 CountArray[Offset] = 1 ;
 CountUpArray[Offset] = UpDay ;
 Location = Offset ;
 end ;
if LastBarOnChart then
 MyTest = Pattern ;
for LoopCounter = 0 to Offset
 begin
 if MyTest = PatternArray[LoopCounter] then
  begin
  ReportLocation = LoopCounter ;
  LoopCounter = Offset + 1 ;
  end ;
 end ;
if LastBarOnChart then
 begin
 Plot1( Pattern, "Pattern" ) ;
 Plot2( CountArray[ReportLocation], "Events" ) ;
 Plot3( CountUpArray[ReportLocation], "Up" ) ;
 end ;
--Mark MillsGO BACK
TradeStation Securities, Inc.
www.TradeStationWorld.com
METASTOCK: Targeting Your Pattern
Massimiliano Scorpio's article, "Targeting Your Pattern," describes an EasyLanguage ShowMe study to analyze price patterns. Here is the formula to create a MetaStock Expert Advisor version of this study. Most of the Expert Advisor is contained in the commentary and will produce a display similar to the example shown here.

This is a mix of formatted text and formulas. You do not have to format your display to exactly match the sample output. Bolded and underlined text and bullets were used for esthetics but are not required.
FIGURE 2: METASTOCK, TARGETING YOUR PATTERN. Here is the formula to create a MetaStock Expert Advisor version of this study. Most of the Expert Advisor is contained in the commentary and will produce a display similar to the example shown here.
To create the Expert Advisor in MetaStock:
1. In the Tools menu, select Expert Advisor.Analysis of
2. Click New to open the Expert Editor for a new expert.
3. Type a name for the expert, like "Pattern Analysis."
4. Click the Commentary tab.
5. Enter the following text:
<Name> (<Symbol>)
as of <date>
As a reminder, here are the definitions of the six numbers:The current bar has the Open/High/Low/Close pattern Writeval(p1:=Ref(L,-1)-ATR(10); p2:=Ref(L,-1); p3:=Ref((H+L)/2,-1); p4:=Ref(H,-1); p5:=Ref(H,-1)+ATR(10); If(O<=p1,0, If(O>p1 AND O<=p2,1, If(O>p2 AND O<=p3,2, If(O>p3 AND O<=p4,3, If(O>p4 AND O<=p5,4, 5))))),5.0) Writeval(p1:=Ref(L,-1)-ATR(10); p2:=Ref(L,-1); p3:=Ref((H+L)/2,-1); p4:=Ref(H,-1); p5:=Ref(H,-1)+ATR(10); If(H<=p1,0, If(H>p1 AND H<=p2,1, If(H>p2 AND H<=p3,2, If(H>p3 AND H<=p4,3, If(H>p4 AND H<=p5,4, 5))))),0.0) Writeval(p1:=Ref(L,-1)-ATR(10); p2:=Ref(L,-1); p3:=Ref((H+L)/2,-1); p4:=Ref(H,-1); p5:=Ref(H,-1)+ATR(10); If(L<=p1,0, If(L>p1 AND L<=p2,1, If(L>p2 AND L<=p3,2, If(L>p3 AND L<=p4,3, If(L>p4 AND L<=p5,4, 5))))),0.0) Writeval(p1:=Ref(L,-1)-ATR(10); p2:=Ref(L,-1); p3:=Ref((H+L)/2,-1); p4:=Ref(H,-1); p5:=Ref(H,-1)+ATR(10); If(C<=p1,0, If(C>p1 AND C<=p2,1, If(C>p2 AND C<=p3,2, If(C>p3 AND C<=p4,3, If(C>p4 AND C<=p5,4, 5))))),0.0) This means: * The Open is writeif(O<=Ref(L,-1)-ATR(10),"less than the previous bar's Low minus a 10-period Average True Range", "writeif((O>Ref(L,-1)-ATR(10)) AND O<=Ref(L,-1)," less than the previous bar's Low but greater than the previous Low minus a 10-period Average True Range","writeif(O>Ref(L,-1) AND O<=Ref((H+L)/2,-1),"less than the previous bar's midpoint but greater than the previous Low","writeif(O>Ref((H+L)/2,-1) AND O<=Ref(H,-1),"greater than the previous bar's midpoint but less than the previous bar's High","writeif(O>Ref(H,-1) AND (O<=Ref(H,-1)+ATR(10)),"greater than the previous bar's High but less than the previous High plus a 10-period Average True Range", "writeif(O>Ref(H,-1)+ATR(10),"greater than the previous bar's High plus a 10-period Average True Range.")")")")")") * The High is writeif(H<=Ref(L,-1)-ATR(10),"less than the previous bar's Low minus a 10-period Average True Range","writeif((H>Ref(L,-1)-ATR(10)) AND H<=Ref(L,-1),"less than the previous bar's Low but greater than the previous Low minus a 10-period Average True Range","writeif(H>Ref(L,-1) AND H<=Ref((H+L)/2,-1),"less than the previous bar's midpoint but greater than the previous Low","writeif(H>Ref((H+L)/2,-1) AND H<=Ref(H,-1), "greater than the previous bar's midpoint but less than the previous bar's High", "writeif(H>Ref(H,-1) AND (H<=Ref(H,-1)+ATR(10)),"greater than the previous bar's High but less than the previous High plus a 10-period Average True Range", "writeif(H>Ref(H,-1)+ATR(10),"greater than the previous bar's High plus a 10-period Average True Range.")")")")")") * The Low is writeif(L<=Ref(L,-1)-ATR(10),"less than the previous bar's Low minus a 10-period Average True Range","writeif((L>Ref(L,-1)-ATR(10)) AND L<=Ref(L,-1),"less than the previous bar's Low but greater than the previous Low minus a 10-period Average True Range","writeif(L>Ref(L,-1) AND L<=Ref((H+L)/2,-1),"less than the previous bar's midpoint but greater than the previous Low","writeif(L>Ref((H+L)/2,-1) AND L<=Ref(H,-1), "greater than the previous bar's midpoint but less than the previous bar's High", "writeif(L>Ref(H,-1) AND (L<=Ref(H,-1)+ATR(10)),"greater than the previous bar's High but less than the previous High plus a 10-period Average True Range", "writeif(L>Ref(H,-1)+ATR(10),"greater than the previous bar's High plus a 10-period Average True Range.")")")")")") * The Close is writeif(C<=Ref(L,-1)-ATR(10),"less than the previous bar's Low minus a 10-period Average True Range","writeif((C>Ref(L,-1)-ATR(10)) AND C<=Ref(L,-1),"less than the previous bar's Low but greater than the previous Low minus a 10-period Average True Range","writeif(C>Ref(L,-1) AND C<=Ref((H+L)/2,-1),"less than the previous bar's midpoint but greater than the previous Low","writeif(C>Ref((H+L)/2,-1) AND C<=Ref(H,-1),"greater than the previous bar's midpoint but less than the previous bar's High", "writeif(C>Ref(H,-1) AND (C<=Ref(H,-1)+ATR(10)),"greater than the previous bar's High but less than the previous High plus a 10-period Average True Range", "writeif(C>Ref(H,-1)+ATR(10),"greater than the previous bar's High plus a 10-period Average True Range.")")")")")") Out of the writeval(cum(1),0.0) prior bars, this pattern was repeated writeval( p1:=Ref(L,-1)-ATR(10); p2:=Ref(L,-1); p3:=Ref((H+L)/2,-1); p4:=Ref(H,-1); p5:=Ref(H,-1)+ATR(10); patpos:= If(O<=p1,0, If(O>p1 AND O<=p2,1, If(O>p2 AND O<=p3,2, If(O>p3 AND O<=p4,3, If(O>p4 AND O<=p5,4, 5)))))*1000 + If(H<=p1,0, If(H>p1 AND H<=p2,1, If(H>p2 AND H<=p3,2, If(H>p3 AND H<=p4,3, If(H>p4 AND H<=p5,4, 5)))))* 100 + If(L<=p1,0, If(L>p1 AND L<=p2,1, If(L>p2 AND L<=p3,2, If(L>p3 AND L<=p4,3, If(L>p4 AND L<=p5,4, 5)))))* 10 + If(C<=p1,0, If(C>p1 AND C<=p2,1, If(C>p2 AND C<=p3,2, If(C>p3 AND C<=p4,3, If(C>p4 AND C<=p5,4, 5))))); cum(patpos=lastvalue(patpos+prev-prev)),0.0) times. For this data the pattern has occured writeval( p1:=Ref(L,-1)-ATR(10); p2:=Ref(L,-1); p3:=Ref((H+L)/2,-1); p4:=Ref(H,-1); p5:=Ref(H,-1)+ATR(10); patpos:= If(O<=p1,0, If(O>p1 AND O<=p2,1, If(O>p2 AND O<=p3,2, If(O>p3 AND O<=p4,3, If(O>p4 AND O<=p5,4, 5)))))*1000 + If(H<=p1,0, If(H>p1 AND H<=p2,1, If(H>p2 AND H<=p3,2, If(H>p3 AND H<=p4,3, If(H>p4 AND H<=p5,4, 5)))))* 100 + If(L<=p1,0, If(L>p1 AND L<=p2,1, If(L>p2 AND L<=p3,2, If(L>p3 AND L<=p4,3, If(L>p4 AND L<=p5,4, 5)))))* 10 + If(C<=p1,0, If(C>p1 AND C<=p2,1, If(C>p2 AND C<=p3,2, If(C>p3 AND C<=p4,3, If(C>p4 AND C<=p5,4, 5))))); (cum(patpos=lastvalue(patpos+prev-prev))/cum(1))*100,5.1) percent of the time. On the writeval( p1:=Ref(L,-1)-ATR(10); p2:=Ref(L,-1); p3:=Ref((H+L)/2,-1); p4:=Ref(H,-1); p5:=Ref(H,-1)+ATR(10); patpos:= If(O<=p1,0, If(O>p1 AND O<=p2,1, If(O>p2 AND O<=p3,2, If(O>p3 AND O<=p4,3, If(O>p4 AND O<=p5,4, 5)))))*1000 + If(H<=p1,0, If(H>p1 AND H<=p2,1, If(H>p2 AND H<=p3,2, If(H>p3 AND H<=p4,3, If(H>p4 AND H<=p5,4, 5)))))* 100 + If(L<=p1,0, If(L>p1 AND L<=p2,1, If(L>p2 AND L<=p3,2, If(L>p3 AND L<=p4,3, If(L>p4 AND L<=p5,4, 5)))))* 10 + If(C<=p1,0, If(C>p1 AND C<=p2,1, If(C>p2 AND C<=p3,2, If(C>p3 AND C<=p4,3, If(C>p4 AND C<=p5,4, 5))))); cum(patpos=lastvalue(patpos+prev-prev))-1,0.0) previous occurrences of this pattern: The next days close was greater than its open writeval( p1:=Ref(L,-1)-ATR(10); p2:=Ref(L,-1); p3:=Ref((H+L)/2,-1); p4:=Ref(H,-1); p5:=Ref(H,-1)+ATR(10); patpos:= If(O<=p1,0, If(O>p1 AND O<=p2,1, If(O>p2 AND O<=p3,2, If(O>p3 AND O<=p4,3, If(O>p4 AND O<=p5,4, 5)))))*1000 + If(H<=p1,0, If(H>p1 AND H<=p2,1, If(H>p2 AND H<=p3,2, If(H>p3 AND H<=p4,3, If(H>p4 AND H<=p5,4, 5)))))* 100 + If(L<=p1,0, If(L>p1 AND L<=p2,1, If(L>p2 AND L<=p3,2, If(L>p3 AND L<=p4,3, If(L>p4 AND L<=p5,4, 5)))))* 10 + If(C<=p1,0, If(C>p1 AND C<=p2,1, If(C>p2 AND C<=p3,2, If(C>p3 AND C<=p4,3, If(C>p4 AND C<=p5,4, 5))))); cum(ref(patpos,-1)=lastvalue(patpos+prev-prev) AND C>O),0.0) time(s) or writeval(p1:=Ref(L,-1)-ATR(10); p2:=Ref(L,-1); p3:=Ref((H+L)/2,-1); p4:=Ref(H,-1); p5:=Ref(H,-1)+ATR(10); patpos:= If(O<=p1,0, If(O>p1 AND O<=p2,1, If(O>p2 AND O<=p3,2, If(O>p3 AND O<=p4,3, If(O>p4 AND O<=p5,4, 5)))))*1000 + If(H<=p1,0, If(H>p1 AND H<=p2,1, If(H>p2 AND H<=p3,2, If(H>p3 AND H<=p4,3, If(H>p4 AND H<=p5,4, 5)))))* 100 + If(L<=p1,0, If(L>p1 AND L<=p2,1, If(L>p2 AND L<=p3,2, If(L>p3 AND L<=p4,3, If(L>p4 AND L<=p5,4, 5)))))* 10 + If(C<=p1,0, If(C>p1 AND C<=p2,1, If(C>p2 AND C<=p3,2, If(C>p3 AND C<=p4,3, If(C>p4 AND C<=p5,4, 5))))); (cum(ref(patpos,-1)=lastvalue(patpos+prev-prev) and c>O))/cum(ref(patpos,-1)=lastvalue(patpos+prev-prev))*100,5.1) percent. The next days close was less than its open writeval(p1:=Ref(L,-1)-ATR(10); p2:=Ref(L,-1); p3:=Ref((H+L)/2,-1); p4:=Ref(H,-1); p5:=Ref(H,-1)+ATR(10); patpos:= If(O<=p1,0, If(O>p1 AND O<=p2,1, If(O>p2 AND O<=p3,2, If(O>p3 AND O<=p4,3, If(O>p4 AND O<=p5,4, 5)))))*1000 + If(H<=p1,0, If(H>p1 AND H<=p2,1, If(H>p2 AND H<=p3,2, If(H>p3 AND H<=p4,3, If(H>p4 AND H<=p5,4, 5)))))* 100 + If(L<=p1,0, If(L>p1 AND L<=p2,1, If(L>p2 AND L<=p3,2, If(L>p3 AND L<=p4,3, If(L>p4 AND L<=p5,4, 5)))))* 10 + If(C<=p1,0, If(C>p1 AND C<=p2,1, If(C>p2 AND C<=p3,2, If(C>p3 AND C<=p4,3, If(C>p4 AND C<=p5,4, 5))))); cum(ref(patpos,-1)=lastvalue(patpos+prev-prev) AND C<O),0.0) time(s) or writeval(p1:=Ref(L,-1)-ATR(10); p2:=Ref(L,-1); p3:=Ref((H+L)/2,-1); p4:=Ref(H,-1); p5:=Ref(H,-1)+ATR(10); patpos:= If(O<=p1,0, If(O>p1 AND O<=p2,1, If(O>p2 AND O<=p3,2, If(O>p3 AND O<=p4,3, If(O>p4 AND O<=p5,4, 5)))))*1000 + If(H<=p1,0, If(H>p1 AND H<=p2,1, If(H>p2 AND H<=p3,2, If(H>p3 AND H<=p4,3, If(H>p4 AND H<=p5,4, 5)))))* 100 + If(L<=p1,0, If(L>p1 AND L<=p2,1, If(L>p2 AND L<=p3,2, If(L>p3 AND L<=p4,3, If(L>p4 AND L<=p5,4, 5)))))* 10 + If(C<=p1,0, If(C>p1 AND C<=p2,1, If(C>p2 AND C<=p3,2, If(C>p3 AND C<=p4,3, If(C>p4 AND C<=p5,4, 5))))); (cum(ref(patpos,-1)=lastvalue(patpos+prev-prev) and c<O))/cum(ref(patpos,-1)=lastvalue(patpos+prev-prev))*100,5.1) percent. The next days close was equal to its open writeval(p1:=Ref(L,-1)-ATR(10); p2:=Ref(L,-1); p3:=Ref((H+L)/2,-1); p4:=Ref(H,-1); p5:=Ref(H,-1)+ATR(10); patpos:= If(O<=p1,0, If(O>p1 AND O<=p2,1, If(O>p2 AND O<=p3,2, If(O>p3 AND O<=p4,3, If(O>p4 AND O<=p5,4, 5)))))*1000 + If(H<=p1,0, If(H>p1 AND H<=p2,1, If(H>p2 AND H<=p3,2, If(H>p3 AND H<=p4,3, If(H>p4 AND H<=p5,4, 5)))))* 100 + If(L<=p1,0, If(L>p1 AND L<=p2,1, If(L>p2 AND L<=p3,2, If(L>p3 AND L<=p4,3, If(L>p4 AND L<=p5,4, 5)))))* 10 + If(C<=p1,0, If(C>p1 AND C<=p2,1, If(C>p2 AND C<=p3,2, If(C>p3 AND C<=p4,3, If(C>p4 AND C<=p5,4, 5))))); cum(ref(patpos,-1)=lastvalue(patpos+prev-prev) AND C=O),0.0) time(s) or writeval(p1:=Ref(L,-1)-ATR(10); p2:=Ref(L,-1); p3:=Ref((H+L)/2,-1); p4:=Ref(H,-1); p5:=Ref(H,-1)+ATR(10); patpos:= If(O<=p1,0, If(O>p1 AND O<=p2,1, If(O>p2 AND O<=p3,2, If(O>p3 AND O<=p4,3, If(O>p4 AND O<=p5,4, 5)))))*1000 + If(H<=p1,0, If(H>p1 AND H<=p2,1, If(H>p2 AND H<=p3,2, If(H>p3 AND H<=p4,3, If(H>p4 AND H<=p5,4, 5)))))* 100 + If(L<=p1,0, If(L>p1 AND L<=p2,1, If(L>p2 AND L<=p3,2, If(L>p3 AND L<=p4,3, If(L>p4 AND L<=p5,4, 5)))))* 10 + If(C<=p1,0, If(C>p1 AND C<=p2,1, If(C>p2 AND C<=p3,2, If(C>p3 AND C<=p4,3, If(C>p4 AND C<=p5,4, 5))))); (cum(ref(patpos,-1)=lastvalue(patpos+prev-prev) and c=O))/cum(ref(patpos,-1)=lastvalue(patpos+prev-prev))*100,5.1) percent.
0: below the previous bar's low minus the value of the 10-bar ATR
1: between the previous bar's low and its low minus the value of the 10-bar ATR
2: between the previous bar's low and the middle of its range
3: between the previous bar's high and the middle of its range
4: between the previous bar's high and the high plus the value of the 10-bar ATR
5: above the previous bar's high plus the value of the 10-bar ATR
After entering the above text, you may click OK to close the Expert Editor, or you may create symbols to show where specific patterns are occurring. For the latter:
1. Select the Symbols tab
2. Click New to make a new symbol.
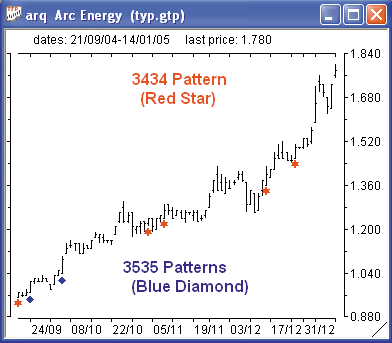
3. Type the name of the symbol. (for example: "3535 pattern")
4. Click in the condition window and type in the following formula:
target:=3535;
p1:=Ref(L,-1)-ATR(10);
p2:=Ref(L,-1);
p3:=Ref((H+L)/2,-1);
p4:=Ref(H,-1);
p5:=Ref(H,-1)+ATR(10);
patpos:=If(O<=p1,0, If(O>p1 AND O<=p2,1,
If(O>p2 AND O<=p3,2, If(O>p3 AND O<=p4,3,
If(O>p4 AND O<=p5,4, 5)))))*1000 +
If(H<=p1,0, If(H>p1 AND H<=p2,1,
If(H>p2 AND H<=p3,2, If(H>p3 AND H<=p4,3,
If(H>p4 AND H<=p5,4, 5)))))* 100 +
If(L<=p1,0, If(L>p1 AND L<=p2,1,
If(L>p2 AND L<=p3,2, If(L>p3 AND L<=p4,3,
If(L>p4 AND L<=p5,4, 5)))))* 10 +
If(C<=p1,0, If(C>p1 AND C<=p2,1,
If(C>p2 AND C<=p3,2, If(C>p3 AND C<=p4,3,
If(C>p4 AND C<=p5,4, 5)))));
patpos=target
5. Select the Graphics tab.
6. Choose a symbol (like diamond).
7. Select a color for the symbol.
8. Choose whether to display the symbol above or below the price bar.
9. Click OK.
10. Additional symbols can be created by repeating steps 7-14. To find
different patterns, change the number on the first line to the desired
pattern. Make sure this line ends with a semicolon.
11. Click OK to close the Expert Editor.
-William GolsonGO BACK
Equis International
www.metastock.com
WEALTH-LAB: Targeting Your Pattern
Using the pattern-coding methodology described by Massimiliano Scorpio in his article in this issue, "Targeting Your Pattern," we created an analysis-type ChartScript that uses a simple class object to keep track of the bars on which each pattern occurs. The object makes it easy to gather and sort the statistics for each code, and the data is blended with HTML code for output to the Commentary Window.
Going a step further, the script ranks all detected patterns by number of observations (Figure 3). Average long returns for each pattern are calculated for up to Retdays days, where this constant can be changed in the script. For simplicity, the percentage returns assume buying at the open on the day after pattern detection and then selling on the open n days later.

FIGURE 3: WEALTH-LAB, TARGETING YOUR PATTERN. The ChartScript commentary window shows the number of observations and average return of all detected patterns. By clicking on a bar in the chart window, you can see highlighted the n-day average returns that correspond to that bar's pattern code. Future n-day returns for the current bar are plotted in the lower window.
With a simple modification, the script could generate the combined
results of an entire WatchList of symbols. However, as a general word of
caution, analysts should be certain to use out-of-sample data when backtesting
patterns to avoid an optimization trap.
GO BACKWealthScript code: type TPattern = class private PatternCode: integer; BarLst: TList; public constructor Create; procedure Add( Code, Bar: integer ); function Count(): integer; function AvgLongReturn( XBars: integer ): float; end; const RETDAYS = 5; const HILITE_CODE = 3424; const LF = '<br>'; const ETD = '</td>'; const FMT = '0.00%'; const ETR = '</tr>'; var obj: TPattern; var nLst: TList = TList.Create; var PatternLst: TList = TList.Create; var Bar, pCode, j, n, d, ROCPane, hATR, hAvg, hHi, hLo, Z1, Z4, ClikCode: integer; var Cstr, bg: string; var ret: float; constructor TPattern.Create(); begin BarLst := TList.Create; end; procedure TPattern.Add( Code, Bar: integer ); begin PatternCode := Code; BarLst.Add( Bar ); end; function TPattern.Count(): integer; begin Result := BarLst.Count; end; function TPattern.AvgLongReturn( XBars: integer ): float; begin var n, Cnt, Bar: integer; var TotalRet: float = 0; for n := 0 to BarLst.Count - 1 do begin Bar := BarLst.Item( n ); if Bar < BarCount - 1 - XBars then begin { Assume buy on open of next bar, and sell on open after XBars } TotalRet := TotalRet + ROC( Bar + XBars + 1, #Open, XBars ); Inc( Cnt ); end; end; if Cnt = 0 then Result := -123 else Result := TotalRet / Cnt; end; function FindZone( Bar, Series: integer ): integer; begin var V: float = @Series[Bar]; if V >= @Z4[Bar] then Result := 5 else if V >= @hHi[Bar] then Result := 4 else if V >= @hAvg[Bar] then Result := 3 else if V >= @hLo[Bar] then Result := 2 else if V >= @Z1[Bar] then Result := 1 else Result := 0; end; function GetCode( Bar: integer ): integer; begin var O, H, L, C: integer; O := FindZone( Bar, #Open ); H := FindZone( Bar, #High ); L := FindZone( Bar, #Low ); C := FindZone( Bar, #Close ); Result := ( O * 1000 ) + ( H * 100 ) + ( L * 10 ) + C; end; hATR := ATRSeries( 10 ); hAvg := OffsetSeries( #Average, -1 ); hHi := OffsetSeries( #High, -1 ); hLo := OffsetSeries( #Low, -1 ); Z1 := OffsetSeries( SubtractSeries( #Low, hATR ), -1 ); Z4 := OffsetSeries( AddSeries( #High, hATR ), -1 ); for Bar := 30 to BarCount - 1 do begin { PatternLst keeps a collection of unique pattern objects } pCode := GetCode( Bar ); if pCode = HILITE_CODE then SetBarColor( Bar, #Fuchsia ); j := PatternLst.IndexOf( pCode ); if j < 0 then begin obj := TPattern.Create; PatternLst.AddObject( pCode, obj ); end else obj := PatternLst.Object( j ) as TPattern; obj.Add( pCode, Bar ); if Bar = BarCount - 1 then ClikCode := pCode; end; DrawLabel( 'Highlighted bar''s code: ' + IntToStr( HILITE_CODE ), 0 ); { List of pattern counts for sorting } for n := 0 to PatternLst.Count - 1 do begin obj := PatternLst.Object( n ) as TPattern; nLst.AddData( obj.Count, n ); end; nLst.SortNumeric; { Output the patterns and returns to the Commentary window } Cstr := '<h3>' + GetSymbol + ' (' + GetSecurityName + ')</h3>'; Cstr := Cstr + '<b>BarCount: </b>' + IntToStr( BarCount ) + LF; Cstr := Cstr + '<b>Pattern Codes and Average Returns</b>' + LF + '<table border="1"><tr><td>Code</td><td>Obs</td>'; for d := 1 to RETDAYS do Cstr := Cstr + '<td align="center">' + IntToStr( d ) + ETD; AddCommentary( Cstr + ETR ); Cstr := ''; for n := nLst.Count - 1 downto 0 do begin obj := PatternLst.Object( nLst.Data( n ) ) as TPattern; Cstr := Cstr + '<tr><td bgcolor="#D0F0FF">' + FormatFloat( '0000', obj.PatternCode ) + '</td><td align="center">' + IntToStr( obj.Count ) + ETD; bg := 'bgcolor="#FFFFCC">'; if obj.PatternCode = ClikCode then bg := 'bgcolor="#D0F0FF">'; for d := 1 to RETDAYS do begin Cstr := Cstr + '<td align="right" ' + bg; ret := obj.AvgLongReturn( d ); if ret < -100 then Cstr := Cstr + 'N/A' else Cstr := Cstr + FormatFloat( FMT, ret ) ; end; Cstr := Cstr + ETR; end; AddCommentary( Cstr + '</table>' ); { Plot the zone divisions } PlotSeries( hHi, 0, #Blue, #Thin ); PlotSeries( hAvg, 0, #Teal, #Dotted ); PlotSeries( hLo, 0, #Teal, #Thin ); PlotSeries( Z1, 0, 950, #Thin ); PlotSeries( Z4, 0, 950, #Thin ); HideVolume; ROCPane := CreatePane( 100, false, true ); DrawLabel( 'Forward-looking returns', ROCPane ); for n := 1 to RETDAYS do PlotSeriesLabel( OffsetSeries( ROCSeries( #Open, n ), n + 1 ), ROCPane, n * 175, #Thin, IntToStr(n) + '-day' );--Robert Sucher
www.wealth-lab.com
AMIBROKER: Targeting Your Pattern
In "Targeting Your Pattern," Massimiliano Scorpio presents a way to analyze patterns by means of automatic chart commentary. The author concentrates on finding relationships between basic two-bar patterns and next-bar price action and suggests using commentary to find out which patterns work best.

FIGURE 4: AMIBROKER, TARGETING YOUR PATTERN. This AmiBroker screenshot shows a price chart of QQQQ with statistics for a selected pattern (3434) and the colored dots that mark the places where given patterns occurred. Green means that the next bar was up. Red means a down bar. Blue means unchanged (open = close).Automatic commentaries are implemented using formula-driven conditional text output. Implementing such commentaries and indicators in AmiBroker Formula Language (AFL) is straightforward. Ready-to-use code is presented in Listing 1. We decided to use a single indicator formula to output both text and charts, thanks to AmiBroker's ability to completely customize indicator titles.
LISTING 1
Version(4.70); // needs AmiBroker 4.70
function msPattPos( element )
{
   Value1 = Ref( H, -1 );
   Value2 = Ref( L, -1 );
   Value3 = ( Value1 + Value2 )/2;
   Dist = Ref( ATR( 10 ), -1 );
   Value4 = Value1 + Dist;
   Value5 = Value2 - Dist;
   result = IIf( element < Value5, 0,
            IIf( element < Value2, 1,
            IIf( element < Value3, 2,
            IIf( element < Value1, 3,
            IIf( element < Value4, 4,
                              5 ) ) ) ) );
  return result;
}
function msPattToText( patt )
{
 result =
 WriteIf( patt == 0, " is below previous (Low - ATR 10) ",
 WriteIf( patt == 1, " is above (at) previous (Low - ATR 10) and below previous Low ",
 WriteIf( patt == 2, " is above (at) previous Low and below previous Midpoint ",
 WriteIf( patt == 3, " is above (at) previous Midpoint and below previous High ",
 WriteIf( patt == 4, " is above (at) previous High and below (High + ATR 10) ",
 " is above (at) previous (High + ATR(10) " ) ) ) ) );
 return result;
}
function msRecognize()
{
   return 1000 * msPattPos( Open ) + 100 * msPattPos( High ) +
          10 * msPattPos( Low ) + msPattPos( Close );
}
function msPatternDescription( patt )
{
   return "Open: " + msPattToText( round( ( patt / 1000 ) % 10 ) ) + "\n" +
          "High: " + msPattToText( round( ( patt / 100 ) % 10 ) ) + "\n" +
          "Low: " + msPattToText( round( ( patt / 10 ) % 10 ) ) + "\n" +
          "Close: " + msPattToText( round( patt % 10 ) );
}
patts = msRecognize();
// by default use pattern occuring at selected bar
DesiredPattern = SelectedValue( patts );
// if you want manual-entry of pattern code from parameter dialog
// then uncomment the line below
//DesiredPattern=Param("Pattern to look for", 3434, 0, 5555, 0 );
Title = StrFormat("{{NAME}} - {{INTERVAL}} {{DATE}} Open %g, Hi %g,
        Lo %g, Close %g", O, H, L, C);
Title = Title + "\nPattern code is : " + DesiredPattern + "\n" +
        msPatternDescription( DesiredPattern  );
Plot(C, "Price", ParamColor("Color", colorBlack), styleNoTitle |
        ParamStyle("Style") | GetPriceStyle() );
PattCloseAbove = DesiredPattern == patts AND Ref( Close > Open, 1 );
PattCloseBelow = DesiredPattern == patts AND Ref( Close < Open, 1 );
PlotShapes(    ( DesiredPattern == patts ) * shapeCircle ,
            IIf( PattCloseAbove, colorGreen,
            IIf( PattCloseBelow, colorRed, colorBlue ) ),
            0, High, 30 );
NumPatterns = LastValue( Cum( DesiredPattern == patts ) );
NumPattCloseAbove = LastValue( Cum( PattCloseAbove ) );
NumPattCloseBelow = LastValue( Cum( PattCloseBelow ) );
NumPattCloseEqual = NumPatterns - NumPattCloseAbove - NumPattCloseBelow;
Title = Title +
"\n\nTotal number of Patterns: " + NumPatterns +
"\n% on Total Bars: " + 100 * NumPatterns/BarCount +
"\nIn the next bar\n" +
EncodeColor(colorGreen) +
"Close has been above the open " + NumPattCloseAbove +
" (" + NumPattCloseAbove / NumPatterns + "%) times\n" +
EncodeColor(colorRed) +
"Close has been below the open " + NumPattCloseBelow + " (" +
NumPattCloseBelow / NumPatterns +" %) times\n" +
EncodeColor(colorBlue) +
"Close has been equal to the open " + NumPattCloseEqual + " (" +
NumPattCloseEqual / NumPatterns +" %)times";
-Tomasz Janeczko, AmiBroker.com
www.amibroker.com
AMIBROKER: Something Darvas, Something New (ERRATA)
Unfortunately, the AmiBroker code for the June 2005 Traders' Tips column
was missing a parenthesis. We are providing the corrected AmiBroker code
for the June 2005 Traders' Tip based on Daryl Guppy's article, "Something
Darvas, Something New." We apologize for any inconvenience this may have
caused.
GO BACKLISTING 2 Periods = 100; function DarvasHigh( Periods ) { HHVtemp = HHV( High, Periods ); result = HHVTemp; for( i = Periods + 4; i < BarCount; i++ ) { result[ i ] = IIf( H[ i - 3 ] >= HHVTemp[ i - 4 ] AND H[ i - 3 ] > H[ i - 2 ] AND H[ i - 3 ] > H[ i - 1 ] AND H[ i - 3 ] > H[ i ], H[ i - 3 ], result[ i - 1 ] ); } return result; } function NewDarvasHigh( Periods ) { dh = DarvasHigh( Periods ); return dh AND Nz( dh ) != Ref( Nz( dh ), -1 ); } function NewDarvasLow( Periods ) { dh = DarvasHigh( Periods ); ndl = Ref( L, -3 ) < Ref( L, -2 ) AND Ref( L, -3 ) < Ref( L, -1 ) AND Ref( L, -3 ) < L AND Ref( H, -2 ) < dh AND Ref( H, -1 ) < dh AND H < dh; return Nz( ndl ) AND Ref( Nz( ndl ), -1 ) < 1; } function DarvasLow( Periods ) { return ValueWhen( NewDarvasLow( Periods ), Ref( L, -3 ) ); } function DarvasBoxEnd( Periods ) { end = BarsSince( NewDarvasHigh( Periods ) ) < BarsSince( Ref( NewDarvasLow( Periods ), -1 ) ); return Nz( end ) AND NewDarvasLow( Periods ); } function DarvasBoxHigh( Periods ) { dbe = DarvasBoxEnd( Periods ); dbhi = ValueWhen( Nz( dbe ) AND NOT IsNull( Ref( dbe, -1 ) ), DarvasHigh( Periods ) ); return IIf( Nz( dbhi ) == 0, H + 1e-6, dbhi ); } function DarvasBoxLow( Periods ) { dbe = DarvasBoxEnd( Periods ); dblo = ValueWhen( Nz( dbe ) AND NOT IsNull( Ref( dbe, -1 ) ), DarvasLow( Periods ) ); return IIf( Nz( dblo ) == 0, L - 1e-6, dblo ); } function DarvasPossSell( Periods ) { dsl = Low < DarvasBoxLow( Periods ); return Nz( dsl ) AND Ref( Nz( dsl ), -1 ) < Nz( dsl ); } Plot( C, "Price", colorBlack, styleCandle ); Plot( DarvasLow( 100 ), "DL", colorRed ); Plot( DarvasHigh( 100 ), "DH", colorGreen );
-Tomasz Janeczko, AmiBroker.com
www.amibroker.com
eSIGNAL: Targeting Your Pattern
For this month's article by Massimiliano Scorpio, "Targeting Your Pattern," we've provided an indicator named "msTwoBarPatterns.efs," downloadable from eSignal.com and shown below.
The study has options to enter up to five different pattern formulas for identification on the chart. Each formula also has a color option that may be modified through the Edit Studies options. The study will draw a text label with the pattern color and corresponding number from the Edit Studies options. In the lower left corner of the chart, a legend with the assigned color and corresponding patterns' formulas will appear. You can click on the legend to open a shortcut to the Edit Studies options. There is also an option to limit the total number of images drawn per each pattern formula to enhance performance. Simply increase that number to view a longer history of identified patterns.

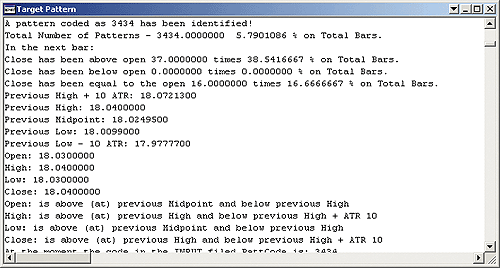
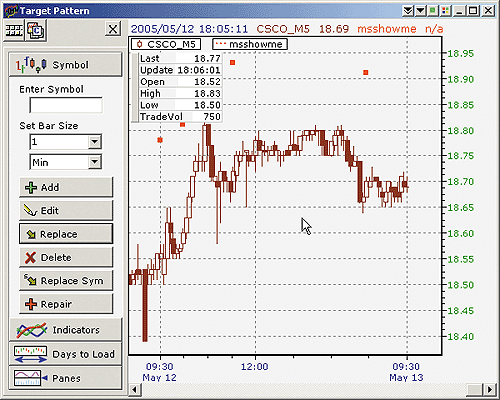
FIGURE 5: eSIGNAL, TARGETING YOUR PATTERN. The study will draw a text label with the pattern color and corresponding number from the Edit Studies options. In the lower left corner of the chart, a legend with the assigned color and corresponding patterns' formulas will appear.Finally, you can also adjust the size of the text labels drawn above the price bars. To view the ShowMe statistics for a particular price bar, you must first open the Formula Output Window (Tools--> EFS menu). Then doubleclick on the text label and you will see the statistics in the Formula Output Window.
/***************************************
Provided By : eSignal (c) Copyright 2005
Description:  Two-Bar Patterns
Version 1.0  5/10/2005
Notes:
July 2005 Issue - "Targeting Your Pattern"
    by Massimiliano Scorpio
This study uses EFS2 functionality available in eSignal
version 7.9 or later.
Formula Parameters:                 Defaults:
Pattern Code 1                      3311
Pattern Code 1 Color                red
Pattern Code 2                      none
Pattern Code 2 Color                blue
Pattern Code 3                      none
Pattern Code 3 Color                green
Pattern Code 4                      none
Pattern Code 4 Color                aqua
Pattern Code 5                      none
Pattern Code 5 Color                magenta
Max number of labels per code.      100
Font Size                           10
***************************************/
function preMain() {
    setPriceStudy(true);
    setStudyTitle("MS Two-Bar Patterns ");
    setShowTitleParameters(false);
    setCursorLabelName("msPattern Code", 0);
    setDefaultBarFgColor(Color.brown, 0);
    setComputeOnClose();
    var fp1 = new FunctionParameter("nPatt1", FunctionParameter.NUMBER);
        fp1.setName("Pattern Code 1");
        fp1.setLowerLimit(0);
        fp1.setDefault(3311);
    var fp2 = new FunctionParameter("cPatt1", FunctionParameter.COLOR);
        fp2.setName("Pattern Code 1 Color");
        fp2.setDefault(Color.red);
    var fp3 = new FunctionParameter("nPatt2", FunctionParameter.NUMBER);
        fp3.setName("Pattern Code 2");
        fp3.setLowerLimit(0);
    var fp4 = new FunctionParameter("cPatt2", FunctionParameter.COLOR);
        fp4.setName("Pattern Code 2 Color");
        fp4.setDefault(Color.blue);
    var fp5 = new FunctionParameter("nPatt3", FunctionParameter.NUMBER);
        fp5.setName("Pattern Code 3");
        fp5.setLowerLimit(0);
    var fp6 = new FunctionParameter("cPatt3", FunctionParameter.COLOR);
        fp6.setName("Pattern Code 3 Color");
        fp6.setDefault(Color.green);
    var fp7 = new FunctionParameter("nPatt4", FunctionParameter.NUMBER);
        fp7.setName("Pattern Code 4");
        fp7.setLowerLimit(0);
    var fp8 = new FunctionParameter("cPatt4", FunctionParameter.COLOR);
        fp8.setName("Pattern Code 4 Color");
        fp8.setDefault(Color.aqua);
    var fp9 = new FunctionParameter("nPatt5", FunctionParameter.NUMBER);
        fp9.setName("Pattern Code 5");
        fp9.setLowerLimit(0);
    var fp10 = new FunctionParameter("cPatt5", FunctionParameter.COLOR);
        fp10.setName("Pattern Code 5 Color");
        fp10.setDefault(Color.magenta);
    var fpz1 = new FunctionParameter("nImageLimit", FunctionParameter.NUMBER);
        fpz1.setName("Max number of labels per code.");
        fpz1.setDefault(100);
    var fpz2 = new FunctionParameter("nFontSize", FunctionParameter.NUMBER);
        fpz2.setName("Font Size");
        fpz2.setDefault(10);
}
var bVersion = null;
var nCntr = 0; // image counter
var aCodes = new Array();  // stores code for bars' with identified patterns
var bInit = true;
var nP1 = null;
var nP2 = null;
var nP3 = null;
var nP4 = null;
var nP5 = null;
function main(nPatt1, cPatt1, nPatt2, cPatt2, nPatt3, cPatt3,
        nPatt4, cPatt4, nPatt5, cPatt5, nImageLimit, nFontSize) {
    if (bVersion == null) bVersion = verify();
    if (bVersion == false) return;
    var nState = getBarState();
    var sCode = getPattern();
    aCodes[getValue("rawtime")] = sCode;
    if (bInit == true) {
        if (nPatt1 > 0) nP1 = nPatt1;
        if (nPatt2 > 0) nP2 = nPatt2;
        if (nPatt3 > 0) nP3 = nPatt3;
        if (nPatt4 > 0) nP4 = nPatt4;
        if (nPatt5 > 0) nP5 = nPatt5;
        bInit = false;
    }
    if (nState == BARSTATE_NEWBAR) {
      if (nCntr > nImageLimit) nCntr = 0;
      else nCntr++;
      for (var i = 1; i <= 5; i++) {
        var patt = eval("nPatt" + i);
        if (!isNaN(patt) && patt != null) {
          drawTextRelative(1, 75 - (i*11), " Code " + i + ": " + patt + " @URL=EFS:edit",
            Color.white, eval("cPatt"+i),
            Text.BOLD|Text.LEFT|Text.RELATIVETOLEFT|Text.RELATIVETOBOTTOM, null, 10,
            "legend" + i);
        }
      }
    }
    // Identify selected pattern codes
    switch (eval(sCode)) {
        case (nPatt1):
            markPattern(1, cPatt1, nFontSize);
            break;
        case (nPatt2):
            markPattern(2, cPatt2, nFontSize);
            break;
        case (nPatt3):
            markPattern(3, cPatt3, nFontSize);
            break;
        case (nPatt4):
            markPattern(4, cPatt4, nFontSize);
            break;
        case (nPatt5):
            markPattern(5, cPatt5, nFontSize);
            break;
    }
    return sCode;
}
/***** Internal Series Functions *****/
/***** Support Functions *****/
function getPattern() {
    var s = "" + getZ(open(0)) + getZ(high(0)) + getZ(low(0)) + getZ(close(0));
    return s;
}
function getZ(nPrice) {
    var zNum = 0;
    var nATR = atr(10);
    var h1 = high(-1);
    var l1 = low(-1);
    var nMidpoint1 = (h1 + l1) / 2;
    if (nPrice < l1 && nPrice >= (l1 - nATR) ) zNum = 1;        // zone 1
    else if (nPrice >= l1 && nPrice < nMidpoint1) zNum = 2;     // zone 2
    else if (nPrice >= nMidpoint1 && nPrice < h1) zNum = 3;     // zone 3
    else if (nPrice >= h1 && nPrice < (h1 + nATR) ) zNum = 4;   // zone 4
    else if (nPrice >= (h1 + nATR) ) zNum = 5;                  // zone 5
    return zNum;
}
function markPattern(num, pattColor, fontSize) {
    drawTextRelative(0, AboveBar1, num+"@URL=EFS:onLButtonDblClk",
        Color.white, pattColor, Text.BOLD|Text.PRESET|Text.CENTER,
        null, eval(fontSize), "Patt" + num + nCntr);
    return;
}
function edit() {
    askForInput("MS Two-Bar Patterns ");
    return;
}
function onLButtonDblClk(barIndex, yValue) {
    if (barIndex == 1) return;
    var barRef = getValue("rawtime", barIndex);
    var patt = aCodes[barRef];
    var pattCount = null;
    var pctTotal = null;
    var nEqual = 0;
    var nBelow = 0;
    var nAbove = 0;
    var pctEqual = 0;
    var pctBelow = 0;
    var pctAbove = 0;
    var nCount = 0;
    var nOldest = getOldestBarIndex();
    var nTot = Math.abs( nOldest + Math.abs(barIndex));
    var barRef = null;
    var nCode = null;
    for (var i = nOldest; i < barIndex; i++) {
        barRef = getValue("rawtime", i);
        nCode = aCodes[barRef];
        if (nCode == patt) {
            nCount++;
            if (close(i+1) == open(i+1)) nEqual++;
            if (close(i+1) <  open(i+1)) nBelow++;
            if (close(i+1) >  open(i+1)) nAbove++;
        }
    }
    pattCount = nCount;
    pctTotal = ((nCount/nTot)*100).toFixed(2);
    if (nEqual > 0) pctEqual = ((nEqual/nCount)*100).toFixed(2);
    if (nBelow > 0) pctBelow = ((nBelow/nCount)*100).toFixed(2);
    if (nAbove > 0) pctAbove = ((nAbove/nCount)*100).toFixed(2);
    var b = false;
    if (nP1 != null && patt == nP1) b = true;
    if (nP2 != null && patt == nP2) b = true;
    if (nP3 != null && patt == nP3) b = true;
    if (nP4 != null && patt == nP4) b = true;
    if (nP5 != null && patt == nP5) b = true;
    if (b == false) return;
    var nATR = atr(10, barIndex);
    var h1 = high(barIndex-1);
    var l1 = low(barIndex-1);
    var nMidpoint1 = (h1 + l1) / 2;
    debugClear();
    Alert.playSound("Pairing.wav");
    debugPrintln("Close has been equal the open " + nEqual + " times " +
        pctEqual + "% on Total Pattern");
    debugPrintln("Close has been below the open " + nBelow + " times " +
        pctBelow + "% on Total Pattern");
    debugPrintln("Close has been above the open " + nAbove + " times " +
        pctAbove + "% on Total Pattern");
    debugPrintln("In the next bar:");
    debugPrintln("Total Number of Patterns " + patt + ": (w/out present bar) " +
        pattCount + " - " + pctTotal + "% on Total Bars.");
    debugPrintln("");
    debugPrintln("Close: is " + getElementDesc(4, patt));
    debugPrintln("Low: is " + getElementDesc(3, patt));
    debugPrintln("High: is " + getElementDesc(2, patt));
    debugPrintln("Open: is " + getElementDesc(1, patt));
    debugPrintln("");
    debugPrintln("Close: " + formatPriceNumber(close(barIndex)));
    debugPrintln("Low:   " + formatPriceNumber(low(barIndex)));
    debugPrintln("High:  " + formatPriceNumber(high(barIndex)));
    debugPrintln("Open:  " + formatPriceNumber(open(barIndex)));
    debugPrintln("");
    debugPrintln("Previous Low - 10 ATR:  " + formatPriceNumber(l1 - nATR) );
    debugPrintln("Previous Low:           " + formatPriceNumber(l1) );
    debugPrintln("Previous Midpoint:      " + formatPriceNumber(nMidpoint1) );
    debugPrintln("Previous High:          " + formatPriceNumber(h1) );
    debugPrintln("Previous High + 10 ATR: " + formatPriceNumber(h1 + nATR) );
    debugPrintln("");
    debugPrintln("Description:");
    debugPrintln("");
    debugPrintln("A Pattern coded as " + patt + " has been identified at bar " + barIndex + "!");
    return;
}
function getElementDesc(nPos, pattcode) {
    var pattDesc0 = "below previous (Low - ATR 10).";
    var pattDesc1 = "above (at) (previous Low - ATR 10) and below previous Low.";
    var pattDesc2 = "above (at) previous Low and below previous Midpoint.";
    var pattDesc3 = "above (at) previous Midpoint and below previous High.";
    var pattDesc4 = "above (at) previous High and below (High +ATR 10).";
    var pattDesc5 = "above (at) previous High + ATR 10.";
    if (pattcode == null) return "N/A.";
    if (pattcode.length < 3) return "N/A.";
    var DescNum = pattcode.charAt(nPos-1);
    switch (DescNum) {
        case "0" :
            DescNum = "0";
            break;
        case "1" :
            DescNum = "1";
            break;
        case "2" :
            DescNum = "2";
            break;
        case "3" :
            DescNum = "3";
            break;
        case "4" :
            DescNum = "4";
            break;
        case "5" :
            DescNum = "5";
            break;
    }
    return eval("pattDesc"+DescNum);
}
function getCount(patt, barIndex) {
}
function verify() {
    var b = false;
    if (getBuildNumber() < 700) {
        drawTextRelative(5, 25, "This study requires version 7.9 or later.",
            Color.black, Color.blue, Text.BOLD|Text.RELATIVETOLEFT|Text.RELATIVETOBOTTOM,
            null, 14, "error");
        drawTextRelative(5, 10, "Click HERE to
            upgrade.@URL=https://www.esignal.com/download/default.asp",
            Color.black, Color.blue, Text.BOLD|Text.RELATIVETOLEFT|Text.RELATIVETOBOTTOM,
            null, 14, "upgrade");
        return;
    } else {
        b = true;
    }
    return b;
}

FIGURE 6: eSIGNAL, TARGETING YOUR PATTERN. To view the ShowMe statistics for a particular price bar, you must first open the Formula Output Window (Tools--> EFS menu). Then doubleclick on the text label and you will see the statistics in the Formula Output Window.To discuss this study or download a complete copy of the formula, please visit the EFS Library Discussion Board forum under the Bulletin Boards link at www.esignalcentral.com.
--Jason Keck
eSignal, a division of Interactive Data Corp.
800 815-8256, www.esignalcentral.com
INVESTOR/RT: Targeting Your Pattern
The zone values as described in "Targeting Your Pattern" by Massimiliano
Scorpio in this issue can be computed for closing prices using the following
custom indicator in Investor/RT:
(CL >= LO.1 - TR.1) +
(CL >= LO.1) +
(CL >= (LO.1 + HI.1)/2) +
(CL >= HI.1) +
(CL > HI.1 + TR.1)
To calculate the zones for the open, high, and low, simply duplicate
the custom indicator given above three times, replacing CL with OP, HI,
and LO, respectively. Each price's zone values are charted in Figure 7,
with a "composite" zone value charted in black in the bottom pane. This
composite zone is simply a summation of the four individual price zones.

FIGURE 7: INVESTOR/RT, TARGETING YOUR PATTERN. This Investor/RT daily candlestick chart of INTC displays custom indicators for the zones of close (blue), high (green), open (orange), and low (red), along with a composite zone in black, which is a summation of the four individual zone values.The composite zone can have 21 different possible values (from zero to 20). This is a simplification of the 3,535 possible zone combinations discussed in the article. However, I created a trading system and subsequent optimization that simply bought 100 shares at the open based on the composite zone value on the previous day. I tested all 21 possible composite zone values from zero to 20. The testing was performed on the 15 highest-volume stocks over the six-year period from 01/01/99 to 05/10/05. The results were rather interesting and can be seen in a spreadsheet:
This Investor/RT Optimization Report shows the results of the 21 different composite zones.Investor/RT Optimization: ZonesComp (05/11/2005 12:25:33) Trading System: ZonesComp Iterations: 21 Time: 3:13 Symbols Tested: 15 (QP:HighVolume) From [01/01/1999 08:00] to [05/10/2005 19:00] Average(APS): -0.056637, Best(APS): 0.3607
ZoneComp APT APS Net %PROF TRADES 20 $36.07 $0.36 $1,298.53 55% 36 3 $9.78 $0.10 $2,288.93 54% 234 5 $5.55 $0.06 $5,565.23 48% 1003 4 $2.88 $0.03 $1,432.60 49% 498 10 ($1.02) ($0.01) ($2,509.85) 47% 2465 6 ($1.38) ($0.01) ($2,833.74) 46% 2052 15 ($1.39) ($0.01) ($1,460.67) 46% 1055 12 ($1.68) ($0.02) ($3,904.79) 47% 2319 8 ($3.37) ($0.03) ($7,574.07) 46% 2248 14 ($3.58) ($0.04) ($7,117.54) 43% 1987 7 ($4.30) ($0.04) ($8,534.40) 46% 1983 16 ($4.83) ($0.05) ($3,125.50) 44% 647 17 ($4.97) ($0.05) ($1,521.47) 47% 306 11 ($6.07) ($0.06) ($13,478.99) 45% 2221 13 ($6.93) ($0.07) ($13,446.04) 46% 1940 9 ($7.44) ($0.07) ($17,053.34) 43% 2293 18 ($9.55) ($0.10) ($3,189.69) 44% 334 19 ($10.15) ($0.10) ($405.86) 35% 40 2 ($10.64) ($0.11) ($2,212.62) 46% 208 1 ($43.08) ($0.43) ($1,120.03) 30% 26 0 ($52.84) ($0.53) ($2,642.04) 30% 50
The results show that the composite zone of 20 clearly produced the best results on a per-share or per-trade basis. However, it was rare that this zone was reached: only 36 trades over six years on 15 stocks (out of 24,000 total trades). Conversely, it appears to be a good idea to short a stock on a day following a composite zone value of 2 or less (0, 1, 2). But again, these conditions are not encountered very frequently. What jumped out at me was the performance of composite zones 3, 4, and 5.
I then decided to take this a step further and test every possible combination
of zone values (0?5) for all four prices (open, high, low, close). I used
the following signal for my entry rule:
CI_CL_ZONE.1 = V#1 AND CI_OP_ZONE.1 = V#2 AND
CI_HI_ZONE.1 = V#3 AND CI_LO_ZONE.1 = V#4
I then ran an optimization on every combination of the four variables (V#1, V#2, V#3, V#4), each ranging from zero to 5. This time, I expanded my test to look at the 124 highest-volume stocks priced above $20, over the same period (01/01/99 to 05/10/05). And again, positions were entered on the open (going long 100 shares) and exited on the close, based on the prior day's combination of the four zone values.
This optimization ran through 1,296 iterations, with each iteration
testing approximately 200,000 bars, taking almost six hours to complete.
A sampling of the results sorted by various statistics, can be seen here:
Biggest Winners (Per Share)
ZoneCL ZoneOP ZoneHI ZoneLO APT APS Net %PROF TRADES 2 4 5 0 $99.66 $1.00 $99.66 100% 1 5 3 5 1 $68.61 $0.69 $3,361.97 59% 49 2 2 3 0 $67.11 $0.67 $3,154.38 57% 47 1 5 5 0 $49.29 $0.49 $49.28 100% 1 0 1 3 0 $39.23 $0.39 $1,686.90 58% 43 Biggest Losers (Per Share)
ZoneCL ZoneOP ZoneHI ZoneLO APT APS Net %PROF TRADES 0 4 5 0 ($142.02) ($1.42) ($284.04) 0% 2 1 4 5 0 ($112.00) ($1.12) ($112.00) 0% 1 3 3 5 1 ($90.36) ($0.90) ($180.73) 0% 2 2 5 5 2 ($79.79) ($0.80) ($718.15) 44% 9 2 5 5 0 ($60.00) ($0.60) ($60.00) 0% 1 Biggest Winners (Net)
ZoneCL ZoneOP ZoneHI ZoneLO APT APS Net %PROF TRADES 1 2 2 1 $3.42 $0.03 $40,071.89 51% 11716 1 1 2 1 $4.17 $0.04 $18,382.80 51% 4414 2 2 3 1 $2.31 $0.02 $16,553.02 49% 7173 1 2 3 1 $1.83 $0.02 $12,243.96 50% 6693 3 2 4 2 $2.82 $0.03 $11,808.55 49% 4186 Biggest Losers (Net)
ZoneCL ZoneOP ZoneHI ZoneLO APT APS Net %PROF TRADES 4 3 4 3 ($4.96) ($0.05) ($57,891.28) 46% 11676 2 3 3 1 ($5.62) ($0.06) ($26,143.50) 47% 4655 2 3 3 2 ($4.47) ($0.05) ($25,433.72) 48% 5694 4 4 4 4 ($7.62) ($0.08) ($20,857.09) 45% 2739 4 3 4 2 ($2.95) ($0.03) ($20,229.94) 48% 6864 Most Trades
ZoneCL ZoneOP ZoneHI ZoneLO APT APS Net %PROF TRADES 1 2 2 1 $3.42 $0.03 $40,071.89 51% 11716 4 3 4 3 ($4.96) ($0.05) ($57,891.28) 46% 11676 3 3 4 2 ($1.32) ($0.01) ($9,633.67) 48% 7288 2 2 3 1 $2.31 $0.02 $16,553.02 49% 7173 4 3 4 2 ($2.95) ($0.03) ($20,229.94) 48% 6864
This is a sampling of the Investor/RT optimization results showing
the biggest winning and losing combinations (per share and net) and the
combinations of zones that resulted in the most trades.
Considering there were a total of approximately 200,000 trades, the biggest winning and losing combinations on a per-share basis produced very few trades. The biggest losers should be looked at as the best shortable opportunities. Actually, most combinations do not produce any trades, as it is impossible, for instance, for the low to be in a zone higher than any of the other three prices. My report showed that only 172 combinations/iterations actually produced any trades.
Optimization reports from both systems discussed, along with the system
definitions (which can be imported into Investor/RT), can be found at:
https://www.linnsoft.com/projects/zones/
This concept can easily be expanded in Investor/RT to create zones
out of any combination of price or volume data, including indicator values.
For instance, RSI, CCI, FASTD, and MACD could each be divided up into six
zones (or however many zones you wish). Then an optimization could be run
to see which combination of these RSI SI, CCI, FASTD, and MACD zones were
most profitable, just as we did here.
--Chad Payne, Linn Software
www.linnsoft.com, info@linnsoft.com
NEUROSHELL TRADER: Targeting Your Pattern
The price pattern position formula described by Massimiliano Scorpio
can be easily implemented in NeuroShell Trader by combining a few of NeuroShell
Trader's more than 800 indicators. To implement the price pattern position
formula, select "New Indicator ..." from the Insert menu and use the Indicator
Wizard to create the following indicators:
value1: Lag( High, 1 )
value2: Lag( Low, 1 )
value3: Avg2( value1, value2 )
value4: Add2( value1, Lag( AvgTrueRange( High, Low, Close, 10 ), 1) )
value5: Subtract( value2, Lag( AvgTrueRange ( High, Low, Close, 10 ), 1) )
msPattPos: IfThenElseIfThen ( A<B(Element, value5), 0,  A<B(Element, value2), 1,
 IfThenElseIfThen ( A<B(Element, value3), 2,  A<B(Element, value1), 3, IfThenElse
 (A<B(Element, value4), 4, 5 ) ) )
The author suggests combining individual digits to create price
patterns and that "the next step is to build, for any time frame, your
own database of recurring and the more profitable patterns." However, this
is exactly the pattern recognition task for which NeuroShell Trader was
designed and at which it excels. Using NeuroShell Trader or one of its
numerous add-ons, you can utilize neural network, clustering, fuzzy logic,
and regression techniques to perform advanced price pattern analysis in
ways that far exceed the capabilities of simply stringing digits together
to match past price patterns.
To create a two-bar price pattern recognition trading system that utilizes
neural networks, select "New Prediction ..." from the Insert menu and
enter the following inputs in the appropriate location of the Prediction
Wizard:
After training the prediction, use the Prediction Analysis button to view the backtest and trade-by-trade statistics for the price pattern recognition trading system. See Figure 8 for some sample early returns.msPattPos ( Open ) msPattPos ( High ) msPattPos ( Low ) msPattPos ( Close ) Lag ( msPattPos ( Open ), 1 ) Lag ( msPattPos ( High ), 1 ) Lag ( msPattPos ( Low ), 1 ) Lag ( msPattPos ( Close ), 1 )

FIGURE 8: NEUROSHELL TRADER, TARGETING YOUR PATTERN. Here are some sample early returns of the price pattern recognition trading system as implemented in NeuroShell.
--Marge Sherald, Ward Systems Group, Inc.
301 662-7950, sales@wardsystems.com
https://www.neuroshell.com

