March 2005
TRADERS' TIPS
You can copy these formulas and programs for easy use in your spreadsheet or analysis software. Simply "select" the desired text by highlighting as you would in any word processing program, then use your standard key command for copy or choose "copy" from the browser menu. The copied text can then be "pasted" into any open spreadsheet or other software by selecting an insertion point and executing a paste command. By toggling back and forth between an application window and the open Web page, data can be transferred with ease.
This month's tips include formulas and programs for:
TRADESTATION: Setting Strike Price Probability
eSIGNAL: Median-average adaptive filter
AMIBROKER: Median-average adaptive filter
NEUROSHELL TRADER: Median-average adaptive filter
NEOTICKER: Median-Average Adaptive Filter
METASTOCK: Directional Breakout
Editor's note: Since the TradeStation code for this month's primary Traders' Tips topic (John Ehlers' article "The Secret Behind The Filter: What's The Difference?" elsewhere in this issue) was already provided in the article by Ehlers, the following TradeStation Traders' Tips submission treats a different topic from a past issue of S&C.
TRADESTATION: SETTING STRIKE PRICE PROBABILITY
David White's article, "Setting Strike Price Probability At Expiration" (S&C, December 2004), describes the calculation of the max-loss point. The max-loss point is the price at which the value of open options is minimized. From the perspective of the option holder, this is the max loss price. The max loss point is calculated by a process of multiplying the put and call option premiums at available strike prices, summing the result, and finding a minimum value point: the max loss point. This can be done in TradeStation: OptionStation using an indicator based on the code provided here.
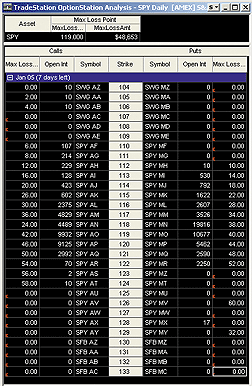
FIGURE 1: TRADESTATION, MAX LOSS POINT. Here's a sample TradeStation: OptionStation analysis for the SPY calculating the max loss point as described in David White's December 2004 article.
Indicator: Max Loss Point (S) {for Option Pane}
variables:
 OIToStore( 0 ),
 Sym( "" ),
 SetTypeRtn( -1 ),
 SetStrikeRtn( -1 ),
 SetOIRtn( -1 ) ;
if CurrentOpenInt <> 0 then
 OIToStore = CurrentOpenInt
else
 OIToStore = PrevOpenInt ;
Sym = Symbol ;
SetTypeRtn = GVSetNamedInt(
 Sym, OptionType of Option ) ;
SetStrikeRtn = GVSetNamedFloat(
 Sym + " Strike", Strike of Option ) ;
SetOIRtn = GVSetNamedInt( Sym + " OI", OIToStore ) ;
if SetTypeRtn < 0 or SetStrikeRtn < 0 or
 SetOIRtn < 0
then
 RaiseRunTimeError(
  Sym + ":  Error setting named variable!" ) ;
Plot1( SetTypeRtn, "SetTypeRtn" ) ;
Indicator: Max Loss Point {for Asset Pane}
variables:
 Index( 0 ),
 Counter( 0 ),
 Sym( "" ),
 ErrorString( "Error!" ),
 NumOpts( 0 ),
 CounterOuter( 0 ),
 StrikeOuter( 0 ),
 CounterInner( 0 ),
 OptTypeInner( 0 ),
 StrikeInner( 0 ),
 OpenIntInner( 0 ),
 MaxLossStrike( 0 ),
 MaxLossAmt( 0 ),
 IntErrorCode( -999 ),
 FltErrorCode( -999.99 ) ;
arrays:
 OptionTypes[200]( 0 ),
 OptionStrikes[200]( 0 ),
 OptionOI[200]( 0 ),
 CallDollarVal[200]( 0 ),
 PutDollarVal[200]( 0 ),
 MaxLossAmts[200]( 0 ) ;

Index = 0 ;
Counter = 0 ;
Sym = GVGetIntNameByNum( Index, ErrorString ) ;
while Sym <> ErrorString
 begin
 OptionTypes[Counter] = GVGetNamedInt(
  Sym, IntErrorCode ) ;
 OptionStrikes[Counter] = GVGetNamedFloat(
  Sym + " Strike", FltErrorCode ) ;
 OptionOI[Counter] = GVGetNamedInt(
  Sym + " OI", IntErrorCode ) ;
 Counter = Counter + 1 ;
 Index = Index + 2 ;
 Sym = GVGetIntNameByNum( Index, ErrorString ) ;
 end ;
NumOpts = Counter ;
for CounterOuter = 0 to NumOpts - 1
 begin
 StrikeOuter = OptionStrikes[CounterOuter] ;
 CallDollarVal[CounterOuter] = 0 ;
 PutDollarVal[CounterOuter] = 0 ;
 MaxLossAmts[CounterOuter] = 0 ;
 CounterInner = 0 ;
 for CounterInner = 0 to NumOpts - 1
  begin
  OptTypeInner = OptionTypes[CounterInner] ;
  StrikeInner = OptionStrikes[CounterInner] ;
  OpenIntInner = OptionOI[CounterInner] ;
  if StrikeInner < StrikeOuter and
   OptTypeInner = Call
  then
    CallDollarVal[CounterOuter] =
    CallDollarVal[CounterOuter] +
    ( StrikeOuter - StrikeInner ) *
    OpenIntInner
  else if StrikeInner > StrikeOuter and
   OptTypeInner = Put then
   PutDollarVal[CounterOuter] =
   PutDollarVal[CounterOuter] + ( StrikeInner
   - StrikeOuter ) * OpenIntInner ;
  end ;
 MaxLossAmts[CounterOuter] =
  CallDollarVal[CounterOuter] +
  PutDollarVal[CounterOuter] ;
 end ;
MaxLossStrike = OptionStrikes[0] ;
MaxLossAmt = MaxLossAmts[0] ;
for Counter = 1 to NumOpts - 1
 begin
 if MaxLossAmts[Counter] < MaxLossAmt then
  begin
  MaxLossAmt = MaxLossAmts[Counter] ;
  MaxLossStrike = OptionStrikes[Counter] ;
  end ;
 end ;
Plot1( MaxLossStrike, "MaxLossStrk" ) ;
Plot2( MaxLossAmt, "MaxLossAmt" ) ;
This code can be downloaded from TradeStationWorld.com. Look for the file
"Max Loss Point.eld." The code will require use of an add-on set of functions
called global variables. These can also be downloaded from TradeStationWorld.com.
Look for the file "Global Variables 2.2.zip."
--Mark MillsGO BACK
TradeStation Securities, Inc.
A subsidiary of TradeStation Group, Inc.
www.TradeStationWorld.com
eSIGNAL: MEDIAN-AVERAGE ADAPTIVE FILTER
For this month's article by John F. Ehlers, "What's The Difference?" we've provided the following indicator, MedianAdaptiveFilter. The study has options to configure the thickness and color of the indicator via the Edit Studies option (Chart Options-->Edit Studies). To discuss these studies or download copies of the formulas, please visit the EFS Library Discussion Board forum under the Bulletin Boards link at www.esignalcentral.com.
Here is an implementation of the median-average adaptive filter in eSignal.
A sample chart is shown in Figure 2.

FIGURE 2: eSIGNAL, MEDIAN ADAPTIVE FILTER. Here is a demonstration of the median adaptive filter in eSignal.
/*****************************************************************

Provided By : eSignal (c) Copyright 2005

Description:  Median-Average Adaptive Filter - by John F. Ehlers

Version 1.0  1/7/2005

Notes:

March 2005 Issue - "The Secret Behind The Filter: What's The Difference?"

Formula Parameters:       Defaults:

Thickness                           2

Color                               Red

*****************************************************************/

function preMain() {
    setPriceStudy(true);
    setStudyTitle("Median-Average Adaptive Filter ");
    setCursorLabelName("MAAF", 0);

    setShowTitleParameters(false);

    // Study Parameters
    var sp1 = new FunctionParameter("nThick", FunctionParameter.NUMBER);
        sp1.setName("Thickness");
        sp1.setDefault(2);
    var sp2 = new FunctionParameter("cColor", FunctionParameter.COLOR);
        sp2.setName("Color");
        sp2.setDefault(Color.red);
}

var bEdit = true;
var Price = new Array(4);
var Smooth = new Array(39);
var nFilter = null;
var nFilter_1 = 0;
var Value2 = 0;
var Value2_1 = 0;
var nThreshold = 0.002

function main(nThick, cColor) {
    if (bEdit == true) {
        setDefaultBarThickness(nThick);
        setDefaultBarFgColor(cColor);
        bEdit = false;
    }

    var nState = getBarState();
    if (nState == BARSTATE_NEWBAR) {
        nFilter_1 = nFilter;
        Value2_1 = Value2;
        Price.pop()
        Price.unshift((high(0)+low(0))/2)
        Smooth.pop();
        Smooth.unshift(0);
    }
    Price[0] = (high(0)+low(0))/2;
    if (Price[3] == null) return;

    Smooth[0] = (Price[0] + (2 * Price[1]) + (2 * Price[2]) + Price[3]) / 6;
    if (Smooth[38] == null) return;

    var Length = 39;
    var Value3 = .2;
    var alpha, Value1;
    while (Value3 > nThreshold) {
        alpha = 2 / (Length + 1);
        Value1 = Median(Length);
        Value2 = alpha*Smooth[0] + (1 - alpha)*Value2_1;
        if (Value1 != 0) Value3 = Math.abs(Value1 - Value2) / Value1;
        Length = Length - 2;
        if (Length <= 0) break;
    }
    if (Length < 3) Length = 3;
    alpha = 2 / (Length + 1);
    nFilter = (alpha*Smooth[0] + (1 - alpha)*nFilter_1);
    return nFilter;
}

function Median(Length) {
    var aArray = new Array(Length);
    var nMedian = null;

    for (var i = 0; i < Length; i++) {
        aArray[i] = Smooth[i];
    }

    aArray = aArray.sort(compareNumbers);

    nMedian = aArray[Math.round((Length-1)/2)];
    return nMedian;
}
function compareNumbers(a, b) {
   return a - b
}
--Jason KeckGO BACK
eSignal, a division of Interactive Data Corp.
800 815-8256, www.esignalcentral.com
AMIBROKER: MEDIAN-AVERAGE ADAPTIVE FILTER
In "What's The Difference?" in this issue, John Ehlers presents an adaptive moving average that adjusts the smoothing parameter depending on the percentage difference between the outputs of the same-length medial and exponential moving average.
Such adaptive filters can be coded easily using the AmiBroker Formula
Language (AFL), and it takes just a few lines of code. Listing 1 shows
the formula that plots a price chart and the adaptive moving average described
in Ehlers' article. A sample chart is shown in Figure 3.
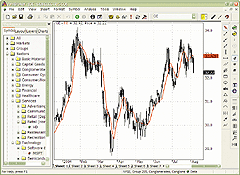
FIGURE 3: AMIBROKER, MEDIAN-AVERAGE ADAPTIVE FILTER. This AmiBroker screenshot shows a GE (General Electric) daily price chart with Ehlers' median-average adaptive filter (red line).
GO BACKLISTING 1 Price = ( H + L ) /2; Threshold = 0.002; Smooth = (Price + 2 * Ref( Price, -1 ) + 2 * Ref( Price, -2 ) + Ref( Price, -3 ) )/6; Length = 39; Value3 = 0.2; AvgLength = 39; for( Length = 39; Length >= 3; Length = Length - 2 ) { alpha = 2 / ( Length + 1 ); Value1 = Median( Smooth, Length ); Value2 = AMA( Smooth, alpha ); Value3 = Nz( abs( Value1 - Value2 )/Value1 ); AvgLength = IIf( Value3 > Threshold, Length, AvgLength ); } alpha = 2 / (AvgLength + 1); Filt = AMA( Smooth, alpha ); Plot( C, "Price", colorBlack, styleCandle ); Plot( Filt, "Filt", colorRed );--Tomasz Janeczko, AmiBroker.com
www.amibroker.com
NEUROSHELL TRADER: MEDIAN-AVERAGE ADAPTIVE FILTER
Ehlers' median-average adaptive filter can be easily implemented in
NeuroShell Trader by using NeuroShell Trader's ability to call functions
written in industry-standard languages. Although most indicators can easily
be built with our point-and-click Indicator Wizard, more complicated ones
may be written in C, C++, Basic, and Pascal. We've created the median-average
adaptive filter in Basic for this tip:
BASIC code for median-average adaptive filter
for use in NeuroShell Trader

Dim i&, Length&
Dim alpha#, FiltPrev#, Value1#, Value2#, Value2prev#, Value3#
Dim Smooth() As Double

  ReDim Smooth(0 To cnt-1)  'Create intermediate arrays
  ReDim sortarray(0 To MAXLENGTH-1) As Double
  For i = 3 To cnt - 1
    Smooth(i) = (@Price[i] + 2 * @Price[i-1] + 2 * @Price[i-2] + @Price[i-3]) / 6
    Length = MAXLENGTH '39
    Value3 = .2
    If i >= Length + 2 Then
      'First good bar requires some initialization of previous values
      If i = Length + 2 Then FiltPrev = Smooth(i-1): Value2prev = Smooth(i-1)
      While Value3 > Threshold
        alpha = 2 / (Length + 1)
        Value1 = Median(Smooth(), i, Length)
        Value2 = alpha * Smooth(i) + (1 - alpha) * Value2prev
        If Value1 <> 0 Then Value3 = Abs(Value1 - Value2) / Value1
        Length = Length - 2
      Wend
      If Length < 3 Then Length = 3
      alpha = 2 / (Length + 1)
      @Filt[i] = alpha * Smooth(i) + (1 - alpha) * FiltPrev
      FiltPrev = @Filt[i]
      Value2prev = Value2
    End If
  Next

  Erase Smooth  'Delete arrays
  Erase sortarray
For more information on NeuroShell Trader, visit www.NeuroShell.com.
--Marge Sherald, Ward Systems Group, Inc.GO BACK
301 662-7950, sales@wardsystems.com
www.neuroshell.com
NEOTICKER: MEDIAN-AVERAGE ADAPTIVE FILTER
To create a NeoTicker version of the median-average adaptive filter presented in "What's The Difference?" by John Ehlers in this issue, an indicator developed using Delphi script is needed.
This indicator has two parameters. The first one is a formula for the
average price series that the average or median is based on, and this has
a default of (H+L) /2. The second one is threshold constant with default
value 0.002. This indicator plots a line that shows the result of the adaptive
filter (Listing 1). A sample chart is shown in Figure 4.
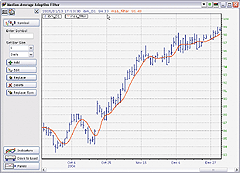
FIGURE 4: NEOTICKER, MEDIAN-AVERAGE ADAPTIVE FILTER
Listing 1
function maa_filter : double;
var ind_smooth : variant;
    mylength, median_pos : integer;
    myalpha, value1, value2, value3, threshold : double;
    prev_value2 : double;
    init_length, i, median_pos : integer;
begin
   threshold := param2.real;
   init_length := 39;
   mylength := 39;
   value3 := 0.2;
   prev_value2 := 0;
   value2 := 0;
   if heap.size = 0 then
   begin
      heap.allocate(mylength+1);
      heap.fill(0, mylength, 0);
   end;
   itself.makeindicator('myprice', 'fml', ['1'], [param1.str]);
   ind_smooth := itself.makeindicator('mysmooth', 'fml', ['myprice'],
                        ['(data1+2*data1(1)+2*data1(2)+data1(3))/6']);
   while value3>threshold do
   begin
      myalpha := 2/(mylength+1);
      for i := 0 to mylength-1 do
         heap.value[i] := ind_smooth.value[i];
      heap.sort(0, mylength-1);
      if (mylength mod 2) > 0 then
      begin
         median_pos := ntlib.trunc(mylength/2);
         value1 := (heap.value[median_pos]+heap.value[median_pos+1])/2;
      end
      else
      begin
         median_pos := mylength/2;
         value1 := heap.value[median_pos];
      end;
      prev_value2 := Value2;
      value2 := myalpha*ind_smooth.value[0]+(1-myalpha)*prev_value2;
      if value1<>0 then
         value3 := ntlib.abs(value1-value2)/value1;
      mylength := mylength-2;
   end;
   if mylength<3 then mylength := 3;
   myalpha := 2/(mylength+1);
   result := myalpha*ind_smooth.value[0]+(1-myalpha)*heap.value[init_length];
   heap.value[init_length] := result;
end;
A downloadable version of this indicator will be available through
the NeoTicker Yahoo! User Group website. Use the Script Manager to install
the script file after the download. After the installation is completed,
this indicator can be used for system testing, in charts, in quote windows,
or in a scanner.
--Kenneth Yuen, TickQuest Inc.
www.tickquest.com
METASTOCK: DIRECTIONAL BREAKOUT
Barbara Star's article in the February 2005 issue of STOCKS & COMMODITIES,
"Directional Breakout," describes two ways of displaying charts. They require
one expert indicator and three custom indicators to reproduce them in MetaStock.
These formulas, and the steps to include them in MetaStock, are shown below.
To build the first chart:To enter the indicators into MetaStock: 1. In the Tools menu, select Indicator Builder. 2. Click New to open the Indicator Editor for a new indicator. 3. Type the name of the formula. 4. Click in the larger window and type in the formula. 5. Click OK. 6. Repeat steps 2-5 for the remaining two formulas. Name: Directional Down Formula: If(H<Mov(C,20,S),-2,0) Name: Directional Up Formula: If(L>Mov(C,20,S),2,0) Name: Non-Directional Formula: c1:=H>=Mov(C,20,S) AND L<=Mov(C,20,S); If(c1,1,0); If(c1,-1,0) To enter the indicators into MetaStock: 1. In the Tools menu, select Expert Advisor. 2. Click New to open the Expert Editor for a new expert. 3. Type a name for the expert, such as "Directional Breakout." 4. Click the Highlights tab. 5. Click New to create a new highlight. 6. Type the name of the highlight. 7. Set the color to that specified. 8. Click in the Condition window and type in the formula. 9. Click OK. 10. Repeat steps 5-9 for the remaining two highlights. 11. Click OK to close the Expert Editor. Name: Directional Down Color: Blue Formula: H<Mov(C,20,S) Name: Directional Up Color: Green Formula: L>Mov(C,20,S) Name: Non-Directional Color: Red Formula: L<=Mov(C,20,S) AND H>=Mov(C,20,S)
1. Open a chart of the security and remove all other indicators.
2. Right-click in the chart and select "Inner Window" and then "New
Inner Window."
3. Click on the title bar of this inner window and drag it below the
price window.
4. Plot the Non-Directional indicator in this window.
5. Select one of the lines and change the style to histogram and the
color to red.
6. Select the other line and make the same changes.
7. Plot the Directional Down indicator in the same window.
8. Select the Directional Down line and change the style to histogram
and the color to blue.
9. Plot the Directional Up indicator in this same window.
10. Select the Directional Up line and change the style to histogram
and the color to green.
11. Plot a 20-period simple moving average of the close in the window
with the prices.
12. Right-click in the chart and select Expert Advisor and then "Attach."
13. Select the Directional Breakout expert and click OK.
14. Right-click in the chart and select Expert Advisor and then "properties."
15. Select the Highlights tab and remove the checks next to the blue
and green highlights.
16. Click OK.
Your chart should now look similar to the one in Figure 5.
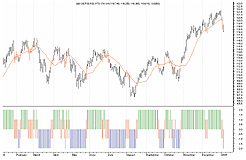
To build the second chart:FIGURE 5: METASTOCK, DIRECTIONAL BREAKOUTS. One way of displaying the directional breakout is by using a histogram.
1. Open a chart of the security and remove all other indicators.
2. Plot a 20-period simple moving average of the close in the window
with the prices.
3. Right-click in the chart and select Expert Advisor and then "Attach."
4. Select the Directional Breakout expert and click OK.
5. Right-click in the chart and select Expert Advisor and then "properties."
6. Select the Highlights tab and make sure all the highlights are checked.
7. Click OK.
Your chart should now look similar to the one in Figure 6.
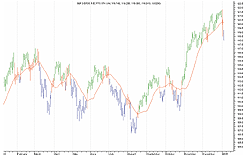
Since the Expert Advisor was changed to make these two charts, you will not be able to use both styles at once, unless you make a second expert and use one for one style and the other for the second style.FIGURE 6: METASTOCK, DIRECTIONAL BREAKOUTS. Another way of displaying the directional breakout is by using colored bars to identify the direction of the breakout.
--William GolsonGO BACK
Equis International
All rights reserved. © Copyright 2005, Technical Analysis, Inc.
Return to March 2005 Contents