But Not The Met
Visiting Moma
The most popular of all technical indicators may be the moving average. The backbone of many trading systems, moving averages are great for filtering out the noise from time series and showing the underlying trend of where the time series has been.Give your moving averages a head start with move-adjusted moving averages.
By definition, however, moving averages on their own can never say anything about the future direction of a time series, regardless of the lookback period used or any standard adjustments or weightings applied to the datapoints. The only way that moving averages can give any indication of the coming direction of a time series is if additional information with some predictive power -- in other words, a leading indicator for the time series in question -- is incorporated into the calculation.
TYPES OF MOVING AVERAGES
A simple moving average (SMA) is calculated by taking the sum of a series of datapoints and dividing it by the number of points in the series. Each subsequent value of the SMA is calculated by including the new datapoint in the calculation and dropping the oldest to keep the number of datapoints in the calculation constant. In an SMA, all the datapoints are given equal weight.
In addition to the SMA, numerous variations of moving averages exist based on giving unequal weights to the datapoints, usually with the idea that the newer data has more relevance to future price action; for these variations, the most recent points are weighted more heavily than older ones.
The weighted moving average (WMA) and the exponential moving average (EMA) are the most common examples of unequally weighted moving averages. A WMA weights the datapoints in a linear manner according to the order in which they occur. For example, in a 10-period WMA the most recent datapoint is given 10 times the weight of the oldest datapoint.
The EMA, on the other hand, weights the datapoints using an exponent that determines the rate at which the weight of previous datapoints diminishes. Neither of these methods introduces any additional information into the calculation, however, and as a consequence, they are useful only for following where the time series has already been, albeit with the advantage of cutting down the lag inherent in an SMA.
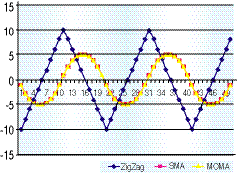
FIGURE 1: 10-PERIOD SMA AND 10-PERIOD MOMA. Since they are applied to a zigzag, both SMA and MOMA exhibit similar behavior. This is because the change between datapoints during reversals in the direction of the zigzag remains constant, giving equal weighting to all datapoints.
VARIATIONS OF MOVING AVERAGES
The two most famous variations on moving averages that introduce additional information into the calculations are the volume-adjusted moving average (VAMA), developed by Richard Arms of Arms index fame, and the volatility-index dynamic average (VIDYA), developed by Tushar Chande.
As its name suggests, VAMA weights the datapoints in the lookback period based on their corresponding relative volume or tick volume. VIDYA, on the other hand, uses a volatility index instead of volume for weighting the datapoints. If this additional information is a leading indicator for future changes in the time series, then a moving average adjusted in this manner can, in theory, have predictive power and go beyond simply showing where a time series has been.
MOVE-ADJUSTED MOVING AVERAGE
Starting with the basics, one of the easiest pieces of additional information that can be introduced into a moving average calculation is the magnitude of the change leading up to each datapoint. Applied to financial market time series, the assumption implicit in such a constructed moving average is that large moves in a given direction are leading indicators of future moves in the same direction.
...Continued in the February issue of Technical Analysis
of STOCKS & COMMODITIES
Excerpted from an article originally published in the February 2005 issue of Technical Analysis of STOCKS & COMMODITIES magazine. All rights reserved. © Copyright 2005, Technical Analysis, Inc.
Return to February 2005 Contents