January 2005
TRADERS' TIPS
You can copy these formulas and programs for easy use in your spreadsheet or analysis software. Simply "select" the desired text by highlighting as you would in any word processing program, then use your standard key command for copy or choose "copy" from the browser menu. The copied text can then be "pasted" into any open spreadsheet or other software by selecting an insertion point and executing a paste command. By toggling back and forth between an application window and the open Web page, data can be transferred with ease.
This month's tips include formulas and programs for:
or return to January 2005 ContentsTRADESTATION: DETECTING BREAKOUTS
AMIBROKER: Detecting Breakouts
WEALTH-LAB: DETECTING BREAKOUTS
eSIGNAL: DETECTING BREAKOUTS
NEUROSHELL TRADER: DETECTING BREAKOUTS
NeoTicker: DETECTING BREAKOUTS
AIQ: Detecting Breakouts
TRADING SOLUTIONS: DETECTING BREAKOUTS
Technifilter plus: detecting breakouts
TRADE NAVIGATOR: DETECTING BREAKOUTS
Aspen graphics: DETECTING BREAKOUTS
Investor/RT: DETECTING BREAKOUTS
TRADESTATION: DETECTING BREAKOUTS
Markos Katsanos' article "Detecting Breakouts In Low-Priced Stocks: Las Vegas Or Los Nasdaq?" describes a system of tests for early determination of conditions suitable for a penny stock's price to "break out" of its established trading range. The tests include Katsanos' finite-volume-element; three linear regression slopes; MACD; a standard-deviation-of-price calculation passed through a stochastic filter; the product of standard deviation of price and the ADX; and the slow K stochastic. For each criterion, a threshold is offered. If all threshold criteria are met, a signal is generated. The following code for a ShowMe study duplicates Katsanos' calculations.
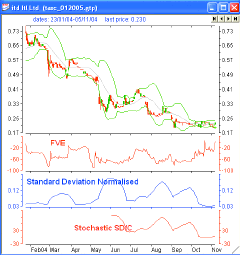
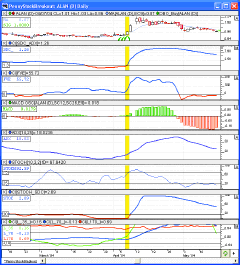
Figure 1 displays plots of the individual indicators that are combined into the ShowMe study (which plots dots on the appropriate price bars). Code for the ShowMe study is provided below. Code for the indicators plotted in the subgraphs on the chart is included, along with the ShowMe code, in the file "K_Volatility.eld," available for download from TradeStation World.com.
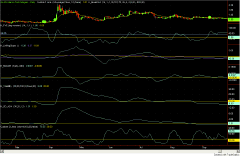
Figure 1: TRADESTATION, DETECTING BREAKOUTS. Here is a sample
ShowMe study chart, displaying plots of the individual indicators in their
appropriate price bars. Note the included code for the indicators plotted
in the subgraphs, as well as the ShowMe code, in the "K_Volatility.ELD"
file.
ShowMe® Study: K_BreakOut
inputs:
Samples( 14 ),
Coef( 0.1 ),
FVE_Threshold( -1 ),
LinearRegLength1( 35 ),
LinearRegLength2( 70 ),
LinearRegLength3( 170 ),
LinearRegThreshold1( 0.35 ),
LinearRegThreshold2( 0.4 ),
LinearRegThreshold3( 0.2 ),
MACD_FastLength( 9 ),
MACD_SlowLength( 20 ),
MACDH_Threshold( -0.003 ),
StDevLength( 30 ),
AverageLength( 30 ),
StDevLookback( 150 ),
StDevSumLength( 3 ),
Price( Close ),
K_VolatilityThreshold( 20 ),
XAverageLength( 10 ),
SD_Period( 30 ),
ADX_Period( 25 ),
SDC_ADX_Threshold( 1.3 ),
StochasticLength( 10 ),
StochasticThreshold( 30 ) ;
variables:
TP( 0 ),
MF( 0 ),
VolumePlusMinus( 0 ),
FVESum( 0 ),
FveFactor( 0 ),
FVE( 0 ),
Intra( 0 ),
VIntra( 0 ),
Inter( 0 ),
VInter( 0 ),
Cutoff( 0 ),
FVE_Condition( false ),
LinearRegCondition1( false ),
LinearRegCondition2( false ),
LinearRegCondition3( false ),
MyMACD( 0 ),
MACDH( 0 ),
MACDH_Condition( false ),
SDC( 0 ),
StDev( 0 ),
MA( 0 ),
LLV( 0 ),
HHV( 0 ),
K_Volatility( 0 ),
K_VolCondition( false ),
XAverageCondition( false ),
SD( 0 ),
SDC2( 0 ),
SDC_ADX( 0 ),
SDC_ADX_Condition( false ),
StochasticCondition( false ),
NumTrue( 0 ) ;
{ FVE requirements }
Intra = Log( High ) - Log( Low ) ;
VIntra = StandardDev( Intra, Samples, 1 ) ;
if TP[1] > 0 then
Inter = Log( TP ) - Log( TP[1] ) ;
VInter = StandardDev( Inter, Samples, 1 ) ;
Cutoff = Coef * ( VInter + VIntra ) * Close ;
MF = Close - 0.5 * ( High + Low ) + TP - TP[1] ;
if BarNumber > Samples then
begin
if MF > CutOff then
VolumePlusMinus = Volume
else if MF < -1 * CutOff then
VolumePlusMinus = -Volume ;
FVEsum = Summation( VolumePlusMinus, Samples ) ;
if ( Average( Volume, Samples ) * Samples ) <> 0
then
FVE = ( FVESum / ( Average( Volume, Samples ) * Samples ) )
* 100 ;
FVE_Condition = FVE > FVE_Threshold ;
end ;
{ Linear regression slope requirements }
Value1 = LinearRegSlope( Close, LinearRegLength1 ) / Close[LinearRegLength1]
* 100 ;
Value2 = LinearRegSlope( Close, LinearRegLength2 ) / Close[LinearRegLength2]
* 100 ;
Value3 = LinearRegSlope( Close, LinearRegLength3 ) / Close[LinearRegLength3]
* 100 ;
LinearRegCondition1 = Value1 > -LinearRegThreshold1 and Value1 <
LinearRegThreshold1 ;
LinearRegCondition2 = Value2 > -LinearRegThreshold2 and Value2 <
LinearRegThreshold2 ;
LinearRegCondition3 = Value3 > -LinearRegThreshold3 ;
{ MACDH requirements }
MyMACD = MACD( Close, MACD_FastLength, MACD_SlowLength ) ;
MACDH = MyMACD - XAverage( MyMACD, MACD_FastLength ) ;
MACDH_Condition = MACDH > MACDH_Threshold ;
{ Standard deviation stochastic evaluation of price volatility }
MA = Average( Price, AverageLength ) ;
StDev = StandardDev( Price, StDevLength, 1 ) ;
SDC = StDev / MA ;
if CurrentBar > StDevLookback + MaxList( AverageLength, StDevLength
) then
begin
LLV = Lowest( SDC, StDevLookBack ) ;
HHV = Highest( SDC, StDevLookBack ) ;
K_Volatility = ( Summation( SDC - LLV , 3) / Summation( HHV -
LLV, 3 ) ) * 100 ;
K_VolCondition = K_Volatility < K_VolatilityThreshold
;
end ;
{ Exponental average price requirement }
XAverageCondition = Close > XAverage( Close, XAverageLength ) ;
{ SD * ADX formula }
SD = StandardDev( Close , SD_Period, 1 ) ;
SDC2 = SD / Average( Close, SD_Period ) ;
SDC_ADX = SDC2 * ADX( ADX_Period ) ;
SDC_ADX_Condition = SDC_ADX < SDC_ADX_Threshold ;
{ Stoch( 10, 3 ) }
StochasticCondition = SlowK( 10 ) > StochasticThreshold ;
if FVE_Condition
and LinearRegCondition1
and LinearRegCondition2
and LinearRegCondition3
and MACDH_Condition
and K_VolCondition
and XAverageCondition
and SDC_ADX_Condition
and StochasticCondition
then
Plot1( Close, "ShowMe" ) ;
NumTrue = 0 ;
if FVE_Condition then NumTrue = NumTrue + 1 ;
if LinearRegCondition1 then NumTrue = NumTrue + 1 ;
if LinearRegCondition2 then NumTrue = NumTrue + 1 ;
if LinearRegCondition3 then NumTrue = NumTrue + 1 ;
if MACDH_Condition then NumTrue = NumTrue + 1 ;
if K_VolCondition then NumTrue = NumTrue + 1 ;
if XAverageCondition then NumTrue = NumTrue + 1 ;
if SDC_ADX_Condition then NumTrue = NumTrue + 1 ;
if StochasticCondition then NumTrue = NumTrue + 1 ;
if AtCommentaryBar then
CommentaryCl(
"FVE: ", FVE, newline,
"LinReg1: ", Value1, newline,
"LinReg2: ", Value2, newline,
"LinReg3: ", Value3, newline,
"MACDH: ", MACDH, newline,
"Volitility: ", K_Volatility, newline,
"XAverage: ", XAverage( Close, XAverageLength ), newline,
"SDC_ADX: ", SDC_ADX, newline,
"Stochastic: ", SlowK( 10 ), newline,
"Num True Conditions: ", NumTrue ) ;
--Mark Mills
TradeStation Securities, Inc.
A subsidiary of TradeStation Group, Inc.
www.TradeStationWorld.com
AMIBROKER: Detecting Breakouts
In his article "Detecting Breakouts In Low-Priced Stocks: Las Vegas Or Los Nasdaq?", Markos Katsanos presents a relatively simple breakout system designed for trading penny stocks. The system itself combines a couple of indicators to detect breakouts from the base.
The code in Listing 1 plots a normalized standard deviation chart, along with the chart of standard deviation multiplied by the ADX indicator. The code in Listing 2 implements the trading system presented in the article.
One note of caution should be added to the system test results presented in the article: The author mentions 2,728% profit gained trading VION over 1,758 days; however, these results are completely unrealistic, due to the fact that the liquidity of the stock in question does not allow one to enter such huge positions that result from compounding. For example, the third trade on VION(50K shares at approximately $0.30) occurs in the middle of April 2004 when total daily trading volume is just about 50K shares. One cannot place such huge orders (almost equal daily trading volume) without influencing stock price. To realistically backtest penny stocks, one needs to use software that allows one to limit the transaction size to certain percentage of daily trading volume so we can safely assume that we don't influence the market by placing our orders. AmiBroker's built-in backtester allows the user to define the limit on trade size, so once the requested position size is too large, it is shrunk down by the backtester. Running the trading system presented in the article with the transaction size limit set to 10% of daily trading volume results in a profit of just 227%, and when the limit is lowered to 5% the profits shrink to 187% over nearly five years. This accounts for only 27% and 24% compounded annual return (Car), respectively.
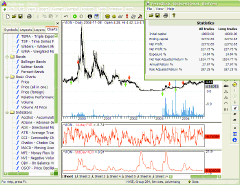
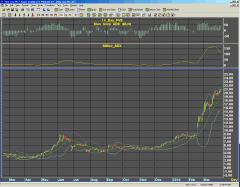
FIGURE 2: AMIBROKER, Detecting Breakouts. The screenshot shows
a VION price chart (upper pane) with a 14-day FVE (middle pane) and a 30-day
standard deviation of closing prices multiplied by a 25-day ADX. In the
upper right, some of the more realistic backtest results (trade size not
larger than 10% of daily volume) are included.
LISTING 1
////////////////////////////////////
// Indicators
////////////////////////////////////
P1=Param("StdDev period", 30, 5, 80 );
P2=Param("ADX period", 25, 5, 80 );
// Normalized standard deviation
SD = StDev(C, P1 );
SDC = SD / MA( C, P1 );
// Standard Deviation * ADX formula
SADX = SDC * ADX( P2 );
Plot( SADX, "StdDev*ADX", colorRed);
Plot( SDC, "Norm. Standard Deviation", colorBlue,
styleOwnScale );
LISTING 2
////////////////////////////////
//Penny Stock breakout Trading system
////////////////////////////////
MACDH = MACD()-Signal();
SDC = StDev( C, 30 ) / MA( C, 30 );
Period = 14;
Coeff = 0.1;
intra = log( H ) - log( L );
Vintra = StDev( intra, Period );
inter = log( Avg ) - log( Ref( Avg, -1 ) );
Vinter = StDev( inter, Period );
Cutoff = Coeff * (Vinter+Vintra) * C;
MF = C - (H+L)/2 + Avg - Ref( Avg, -1 );
MFV = IIf( MF > Cutoff, V, IIf( MF < -Cutoff, -V, 0 ) );
FVE = Sum( MFV, Period ) / MA(V,Period) / Period * 100;
LC35 = 100* LinRegSlope( C, 35 ) / Ref( C, -35 );
LC70 = 100*LinRegSlope( C, 70 ) / Ref( C, -70 );
LC170 = 100*LinRegSlope( C, 170 ) / Ref( C, -170 );
StochSDC = 100 * Sum( SDC - LLV(SDC,150), 3 ) /
Sum( HHV(
SDC, 150 ) - LLV( SDC, 150 ), 3 );
Buy = FVE > -1 AND
LC35 > -0.35 AND
LC35 < 0.40 AND
LC70 > -0.40 AND
LC70 < 0.40 AND
LC170 > -0.20 AND
MACDH > -0.003 AND
StochSDC < 20 AND
C > EMA( C, 10 ) AND
SDC * ADX( 25 ) < 1.3 AND
StochK( 10, 3 ) > 30;
Sell = C < (1 - 18/100) * HHV( C, 2 );
ApplyStop( stopTypeNBar, stopModeBars, 70, True );
Filter = Buy;
AddColumn( FVE, "FVE" );
AddColumn( LC35, "LC35" );
AddColumn( LC70, "LC70" );
AddColumn( LC170, "LC170" );
AddColumn( MACDH, "MACDH", 1.5 );
AddColumn( StochSDC , "StochSDC" );
AddColumn( C , "C" );
AddColumn( EMA( C, 10 ), "EMA(C,10)" );
AddColumn( SDC * ADX( 25 ), "SDC * ADX( 25 )" );
AddColumn( StochK( 10, 3 ) , "StochK( 10, 3 )" );
--Tomasz Janeczko, AmiBroker.com
www.amibroker.com
WEALTH-LAB: DETECTING BREAKOUTS
Visitors to www.wealth-lab.com are invited to run the penny stock breakout ChartScript, which incorporates the trading system rules given in the sidebars to Markos Katsanos' article, "Detecting Breakouts In Low-Priced Stocks: Las Vegas Or Los Nasdaq?" To run this script, click "ChartScripts" in the site's main menu and follow the link to "Search for ChartScripts" by name. Type "penny stock breakout," select the script, enter a symbol, and click Execute.
Using the "Penny" ChartScript, we ran a Wealth-Lab Simulation on six of the stocks mentioned in the article (Alan, Eln, Mace, Siri, Upcs, and Vion) starting from 1/1/2000 to 11/1/2004. Configuring $10,000 fixed sizing and $70,000 starting capital, the system returned $31,368 profit after commissions ($8/trade) with an average exposure of only 11.3%. The average profit of the 17 winning trades (37 total) was $3,464, while the average loss was -$1,376.
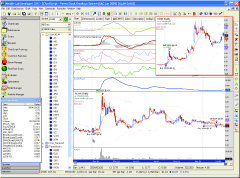
Figure 3: WEALTH-LAB, DETECTING BREAKOUTS. While the trailing
stop helped to protect profits on the ALAN breakout, it put the system
"on the bench," where it watched VION more than quadruple from the exit
price (inset). The Data Window shows the values of all plotted price/indicator
series at the location of the pointer, which is positioned on one of the
signal days.
WealthScript Code:
{ Penny Stock Breakout System }
{$I 'VolModFVE2'}
var
Bar, hSD, hSDC, hStoch_SDC, hADX, hSD_ADX,
hVModFVE, MACDH, i, Ltmp, p: integer;
var StopPrice: float;
var Desc: string;
var bBuy: boolean;
var LRPer: ComVariantArray;
var LR: array[0..2] of integer;
var Pane: array[0..4] of integer;
{ "Stochastic" of a single Price Series }
function StochOfInd( Series, Period, Smooth: integer ): integer;
begin
var LL, HH, N, D: integer;
LL := LowestSeries( Series, Period );
N := SumSeries( SubtractSeries( Series, LL ), Smooth );
HH := HighestSeries( Series, Period );
D := SumSeries( SubtractSeries( HH, LL ), Smooth );
Result := MultiplySeriesValue( DivideSeries( N, D ), 100 );
end;
{ Calculate indicators }
UseUpdatedEMA( true );
hSD := StdDevSeries( #Close, 30 );
hSDC := DivideSeries( hSD, SMASeries( #Close, 30 ) );
hStoch_SDC := StochOfInd( hSDC, 150, 3 );
hADX := ADXSeries( 25 );
hSD_ADX := MultiplySeries( hSDC, hADX );
hVModFVE := VolModFVE2Series( 14, 0.1 );
{ Plotting }
for i := 0 to 4 do
Pane[i] := CreatePane( 50, true, true );
PlotSeriesLabel( hStoch_SDC, Pane[2], #Red, #Thin, 'Stoch(SDC)' );
PlotSeriesLabel( StochDSeries( 10, 3 ), Pane[2], #Blue, #Thin, 'StochD'
);
PlotSeriesLabel( hVModFVE, Pane[1], #Green, #Thick, 'FVE(14)' );
PlotSeriesLabel( hSD_ADX, Pane[0], #Blue, #Thick, 'SD(30)*ADX' );
PlotSeriesLabel( BBandLowerSeries( #Close, 30, 2 ), 0, #Fuchsia, #Dotted,
'BBands(30)' );
PlotSeries( BBandUpperSeries( #Close, 30, 2 ), 0, #Fuchsia, #Dotted
);
PlotSeriesLabel( EMASeries( #Close, 10 ), 0, #Red, #Thin, 'EMA(10)'
);
PlotStops;
{ Calculate and plot the MACD Histogram and signal lines }
MACDH := SubtractSeries( MACDSeries( #Close ), EMASeries( MACDSeries(
#Close ), 9 ) );
PlotSeries( MACDSeries( #Close ), Pane[3], #Maroon, #Thick );
PlotSeries( EMASeries( MACDSeries( #Close ), 9 ), Pane[3], 111, #Thin
);
PlotSeries( MACDH, Pane[3], #Black, #Histogram );
DrawLabel( 'MACD and 9 period Signal Line', Pane[3] );
{ Calculate and plot the 3 LinearRegSlope function series }
LRPer := [ 35, 70, 170 ];
for i := 0 to 2 do
begin
Ltmp := LinearRegSlopeSeries( #Close, LRPer[i] );
Ltmp := DivideSeries( Ltmp, OffsetSeries( #Close, -LRPer[i]
) );
LR[i] := MultiplySeriesValue( Ltmp, 100 );
Desc := 'nLR(' + IntToStr( LRPer[i] ) + ')';
PlotSeriesLabel( LR[i], Pane[4], i * 490 , #Thin, Desc );
SetDescription( LR[i], Desc );
end;
{ Main trading loop }
for Bar := 170 to BarCount - 1 do
begin
if LastPositionActive then
begin
p := LastPosition;
if Bar + 1 - PositionEntryBar( p ) >= 70 then
SellAtMarket( Bar + 1, p, '70-day time
out' )
else
begin
StopPrice := 0.82 * Highest( Bar, #Close,
2 );
SellAtTrailingStop( Bar + 1, StopPrice,
p, 'Stop' );
end;
end
else
begin
bBuy := ( GetSeriesValue( Bar, hVModFVE ) > -1 )
and ( GetSeriesValue( Bar, LR[0] ) >
-0.35 )
and ( GetSeriesValue( Bar, LR[0] ) <
0.4 )
and ( GetSeriesValue( Bar, LR[1] ) >
-0.4 )
and ( GetSeriesValue( Bar, LR[1] ) <
0.4 )
and ( GetSeriesValue( Bar, LR[2] ) >
-0.2 )
and ( GetSeriesValue( Bar, MACDH ) >
-0.003 )
and ( GetSeriesValue( Bar, hStoch_SDC
) < 20 )
and ( PriceClose( Bar ) > EMA( Bar,
#Close, 10 ) )
and ( GetSeriesValue( Bar, hSD_ADX )
< 1.3 )
and ( StochD( Bar, 10, 3 ) > 30 );
if bBuy then
begin
SetBackgroundColor( Bar, #GreenBkg );
BuyAtMarket( Bar + 1, '' );
end;
end;
end;
--Robert Sucher
www.wealth-lab.com
GO BACK
eSIGNAL: DETECTING BREAKOUTS
For this month's article by Markos Katsanos, "Detecting Breakouts In Low-Priced Stocks: Las Vegas Or Los Nasdaq?", we've provided the following code for four indicators: standard deviation multiplied by ADX; normalized standard deviation; stochastic of normalized standard deviation; and the volatility-modified finite volume element study.
All four studies have Edit Studies options to configure the study parameters as well as color and thickness of the indicator lines (Chart Options-->Edit Studies). The stochastic study has some additional parameters to turn on or off the bands and the %D line, which is not displayed by default. The version of the volatility-modified FVE study from the September 2003 issue of Technical Analysis of Stocks & Commodities has been modified for real-time calculations and additional parameters.
Standard Deviation * ADX
/*****************************************************************
Provided By : eSignal (c) Copyright 2004
Description: SD*ADX - by Markos Katsanos from Detecting Breakouts
Version 1.0
Notes:
Formula Parameters:
Defaults:
Period for SD
30
Period for ADX
25
Color
magenta
Thickness
2
*****************************************************************/
function preMain() {
setStudyTitle("SD*ADX ");
setCursorLabelName("SD*ADX");
setDefaultBarThickness(2);
addBand(1.3, PS_SOLID, 1, Color.navy, "band");
setShowTitleParameters(false);
// Formula Parameters
var fp1 = new FunctionParameter("nPeriod", FunctionParameter.NUMBER);
fp1.setName("Period for
SD");
fp1.setLowerLimit(5);
fp1.setUpperLimit(80);
fp1.setDefault(30);
var fp2 = new FunctionParameter("nDI", FunctionParameter.NUMBER);
fp2.setName("Period for
ADX");
fp2.setLowerLimit(5);
fp2.setUpperLimit(80);
fp2.setDefault(25);
// Study Parameters
var sp1 = new FunctionParameter("cColor", FunctionParameter.COLOR);
sp1.setName("Color");
sp1.setDefault(Color.magenta);
var sp2 = new FunctionParameter("nThick", FunctionParameter.NUMBER);
sp2.setName("Thickness");
sp2.setDefault(2);
}
var bEdit = true;
var aPrice = null;
var vStudyMA = null;
var vStudyADX = null;
var nC = null;
function main(nPeriod, nDI, cColor, nThick) {
if (bEdit == true) {
aPrice = new Array(nPeriod);
vStudyMA = new MAStudy(nPeriod,
0, "Close", MAStudy.SIMPLE);
vStudyADX = new ADXDMStudy(nDI,
nDI);
setDefaultBarFgColor(cColor,
0);
setDefaultBarThickness(nThick,
0);
bEdit = false;
}
var nState = getBarState();
if (nState == BARSTATE_NEWBAR && nC != null)
{
aPrice.pop();
aPrice.unshift(nC);
}
nC = close(0);
aPrice[0] = nC;
var vMA = vStudyMA.getValue(MAStudy.MA);
if (vMA == null) return;
var vADX = vStudyADX.getValue(ADXDMStudy.ADX);
if (vADX == null) return;
if (aPrice[nPeriod-1] == null) return; //
array not complete
var nSD = Stdev(nPeriod);
var nSDC = (nSD/vMA);
return (nSDC*vADX);
}
// Support Functions
function Stdev(nLength) {
var sumX = 0;
var sumX2 = 0;
for (i = 0; i < nLength; ++i) {
sumX += aPrice[i];
sumX2 += (aPrice[i] * aPrice[i]);
}
var meanX = (sumX/nLength);
var stdev = Math.sqrt((sumX2/nLength) - (meanX*meanX));
return stdev;
}
/*****************************************************************
Provided By : eSignal (c) Copyright 2004
Description: Normalized Standard Deviation - Markos Katsanos
Version 1.0
Notes:
Formula Parameters:
Defaults:
Length
30
Color
aqua
Thickness
2
*****************************************************************/
function preMain() {
setStudyTitle("Normalized Standard Deviation ");
setCursorLabelName("N-Stdev",0);
// Formula Parameters
var fp1 = new FunctionParameter("Length", FunctionParameter.NUMBER);
fp1.setName("Period");
fp1.setLowerLimit(1);
fp1.setDefault(30);
// Study Parameters
var sp1 = new FunctionParameter("cColor", FunctionParameter.COLOR);
sp1.setName("Color");
sp1.setDefault(Color.aqua);
var sp2 = new FunctionParameter("nThick", FunctionParameter.NUMBER);
sp2.setName("Thickness");
sp2.setDefault(2);
}
var bEdit = true;
var aValue = null;
var vStudy = null;
function main(Length, cColor, nThick) {
if (bEdit == true) {
setDefaultBarFgColor(cColor,
0);
setDefaultBarThickness(nThick,
0);
bEdit = false;
}
if (aValue == null) aValue = new Array(Length);
if (vStudy == null) vStudy = new MAStudy(Length,
0, "Close", MAStudy.SIMPLE);
var nMA = vStudy.getValue(MAStudy.MA);
if (nMA == null) return;
var nState = getBarState();
var nSum = 0;
var ySum = 0;
var Basis = 0;
var vStdDev = 0;
if (nState == BARSTATE_NEWBAR) {
aValue.pop();
aValue.unshift(close(0));
}
aValue[0] = close(0);
if (aValue[Length-1] == null) return;
for(i = 0; i < Length; i++){
nSum += (aValue[i]);
}
Basis=nSum/Length;
for(i = 0; i < Length; i++){
ySum += (aValue[i]-Basis)*(aValue[i]-Basis);
}
vStdDev=Math.sqrt(ySum/(Length));
return (vStdDev/nMA);
}
/*****************************************************************
Provided By : eSignal. (c) Copyright 2004
Description: Stochastic of Normalized Standard Deviation - Markos
Katsanos
Version 1.0
Notes:
Formula Parameters:
Defaults:
Normalized Stdev Period
30
Stoch \%K Length
150
Stoch \%K Smoothing
1
Stoch \%D Length
10
Upper Band
80
Lower Band
20
Band's Color
black
Display Bands
True - [True, False]
%K Color
red
%K Thickness
2
%D Color
blue
%D Thickness
1
%D Display
Off - [On, Off]
*****************************************************************/
function preMain() {
setStudyTitle("Stochastic of Normalized Stdev");
setCursorLabelName("Stoch of SD \%K", 0);
setCursorLabelName("Stoch of SD \%D", 1);
setDefaultBarFgColor(Color.navy, 0);
setDefaultBarFgColor(Color.aqua, 1);
setStudyMax(120);
setStudyMin(-5);
// Primary Study Parameters
var fp1 = new FunctionParameter("Length", FunctionParameter.NUMBER);
fp1.setName("Normalized
Stdev Period");
fp1.setLowerLimit(1);
fp1.setDefault(30);
// Stoch Parameters
var fp2 = new FunctionParameter("nKlength2", FunctionParameter.NUMBER);
fp2.setName("Stoch \%K Length");
fp2.setLowerLimit(1);
fp2.setDefault(150);
var fp3 = new FunctionParameter("nKsmooth2", FunctionParameter.NUMBER);
fp3.setName("Stoch \%K Smoothing");
fp3.setLowerLimit(1);
fp3.setDefault(1);
var fp4 = new FunctionParameter("nDlength2", FunctionParameter.NUMBER);
fp4.setName("Stoch \%D Length");
fp4.setLowerLimit(1);
fp4.setDefault(10);
// Study Parameters
var sp1 = new FunctionParameter("nBand1", FunctionParameter.NUMBER);
sp1.setName("Upper Band");
sp1.setDefault(80);
var sp2 = new FunctionParameter("nBand2", FunctionParameter.NUMBER);
sp2.setName("Lower Band");
sp2.setDefault(20);
var sp3 = new FunctionParameter("cBands", FunctionParameter.COLOR);
sp3.setName("Band's Color");
sp3.setDefault(Color.black);
var sp4 = new FunctionParameter("bBands", FunctionParameter.STRING);
sp4.setName("Display Bands");
sp4.addOption("On");
sp4.addOption("Off");
sp4.setDefault("On");
var sp5 = new FunctionParameter("cK", FunctionParameter.COLOR);
sp5.setName("\%K Color");
sp5.setDefault(Color.red);
var sp6 = new FunctionParameter("nThickK", FunctionParameter.NUMBER);
sp6.setName("\%K Thickness");
sp6.setDefault(2);
var sp7 = new FunctionParameter("cD", FunctionParameter.COLOR);
sp7.setName("\%D Color");
sp7.setDefault(Color.blue);
var sp8 = new FunctionParameter("nThickD", FunctionParameter.NUMBER);
sp8.setName("\%D Thickness");
sp8.setDefault(1);
var sp9 = new FunctionParameter("bD", FunctionParameter.STRING);
sp9.setName("\%D Display");
sp9.addOption("On");
sp9.addOption("Off");
sp9.setDefault("Off");
}
// Primary Study: Normalized Stdev
var aNormStdev = null;
var aValue = null;
var vStudy = null;
// Stoch of Primary Study
var bEdit = true;
var study = null;
var vK2 = null;
var vD2 = null;
var aStochK2 = null;
function main(Length, nKlength2, nKsmooth2, nDlength2, nBand1, nBand2,
cBands, bBands, cK, nThickK, cD, nThickD, bD) {
var nState = getBarState();
if (bEdit == true) {
if (bBands == "On") {
addBand(nBand1, PS_SOLID, 1, cBands, "Upper");
addBand(nBand2, PS_SOLID, 1, cBands, "Lower");
} else if (bBands == "Off")
{
removeBand("Upper");
removeBand("Lower");
}
setDefaultBarFgColor(cK,
0);
setDefaultBarFgColor(cD,
1);
setDefaultBarThickness(nThickK,
0);
setDefaultBarThickness(nThickD,
1);
if (aStochK2 == null) aStochK2
= new Array(Math.round(nDlength2));
bEdit = false;
}
if (nState == BARSTATE_NEWBAR) {
if (vK2 != null) {
aStochK2.pop();
aStochK2.unshift(vK2);
}
}
//primary study code: Stoch of Normalized Stdev
if (aNormStdev == null) aNormStdev = new Array(nKlength2);
if (aValue == null) aValue = new Array(Length);
if (vStudy == null) vStudy = new MAStudy(Length,
0, "Close", MAStudy.SIMPLE);
var nMA = vStudy.getValue(MAStudy.MA);
if (nMA == null) return;
var nSum = 0;
var ySum = 0;
var Basis = 0;
var vStdDev = 0;
if (nState == BARSTATE_NEWBAR) {
aValue.pop();
aValue.unshift(close(0));
aNormStdev.pop();
aNormStdev.unshift(0);
}
aValue[0] = close(0);
if (aValue[Length-1] == null) return;
for(i = 0; i < Length; i++){
nSum += (aValue[i]);
}
Basis=nSum/Length;
for(i = 0; i < Length; i++){
ySum += (aValue[i]-Basis)*(aValue[i]-Basis);
}
vStdDev = (Math.sqrt(ySum/(Length)))/nMA;
aNormStdev[0] = vStdDev;
// end of primary study code
// Stoch of Normalized Stdev
vK2 = StochK2(Math.round(nKlength2), Math.round(nKsmooth2));
if (vK2 == null) return;
aStochK2[0] = vK2;
if (aStochK2[Math.round(nDlength2) - 1] == null)
return;
vD2 = StochD2(Math.round(nDlength2));
if (vD2 == null) return;
if (bD == "On") {
return new Array(vK2, vD2);
} else {
return new Array(vK2, vD2.toFixed(4));
}
}
/*********************/
/***** Functions *****/
/*********************/
function StochHH(nInputOffset, nInputLength) {
var nOffset = nInputOffset;
var nLength = nInputLength;
var hh = 0;
var i = 0;
for(i = 0; i < nLength; i++) {
if(i == 0) {
hh = aNormStdev[i+nOffset];
} else {
hh = Math.max(hh, aNormStdev[i+nOffset]);
}
}
return hh;
}
function StochLL(nInputOffset, nInputLength) {
var nOffset = nInputOffset;
var nLength = nInputLength;
var ll = 0;
var i = 0;
for(i = 0; i < nLength; i++) {
if(i == 0) {
ll = aNormStdev[i+nOffset];
} else {
ll = Math.min(ll, aNormStdev[i+nOffset]);
}
}
return ll;
}
function StochK2(inputLength, inputSmoothing) {
var percentK;
var StochK;
var ll, hh;
var sum = 0;
var i = 0;
var nOffset = 0;
var nDO;
var nLength = inputLength;
var nSmoothing = inputSmoothing;
for(i = 0; i < nSmoothing; i++) {
nDO = i + nOffset;
StochK = aNormStdev[nDO];
ll = StochLL(nDO, nLength);
if(ll == null) return null;
hh = StochHH(nDO, nLength);
if(hh == null) return null;
percentK = ((StochK - ll)
/ (hh - ll)) * 100;
sum += percentK;
}
sum /= nSmoothing;
return sum;
}
function StochD2(nInputLength) {
var sum = 0;
var i = 0;
for (i = 0; i < nInputLength; ++i) {
sum += aStochK2[i];
}
sum /= nInputLength;
return sum;
}
/*******************************************************************
Description : This Indicator plots the Volatility modified FVE formula
Provided By : TS Support, LLC for eSignal
Version 2.0
Notes:
* Original formula code has been modified by eSignal for
real time calculations and additional parameters.
11/8/2004
Formula Parameters:
Defaults:
Periods for FVE
14
EMA Periods for FVE
40
Coef for Cutoff
0.1
FVE Color
green
FVE Thickness
2
FVE EMA Color
blue
FVE EMA Thickness
1
EMA Display
Off - [On, Off]
********************************************************************/
function preMain(){
setStudyTitle("Volatility Finite Volume Elements2");
setCursorLabelName("FVE",0);
setDefaultBarFgColor(Color.green,0);
setCursorLabelName("FVE EMA",1);
setDefaultBarFgColor(Color.blue,1);
setDefaultBarThickness(2);
addBand(0, PS_SOLID, 2, Color.black);
setShowTitleParameters(false);
// Formula Parameters
var fp1 = new FunctionParameter("Samples", FunctionParameter.NUMBER);
fp1.setName("Periods for
FVE");
fp1.setLowerLimit(5);
fp1.setDefault(14);
var fp2 = new FunctionParameter("Perma", FunctionParameter.NUMBER);
fp2.setName("EMA Periods
for FVE");
fp2.setLowerLimit(1);
fp2.setDefault(40);
var fp3 = new FunctionParameter("Coef", FunctionParameter.NUMBER);
fp3.setName("Coef for Cutoff");
fp3.setLowerLimit(0);
fp3.setDefault(.1);
// Study Parameters
var sp1 = new FunctionParameter("cFVE", FunctionParameter.COLOR);
sp1.setName("FVE Color");
sp1.setDefault(Color.green);
var sp2 = new FunctionParameter("nThickFVE", FunctionParameter.NUMBER);
sp2.setName("FVE Thickness");
sp2.setDefault(2);
var sp3 = new FunctionParameter("cEMA", FunctionParameter.COLOR);
sp3.setName("FVE EMA Color");
sp3.setDefault(Color.blue);
var sp4 = new FunctionParameter("nThickEMA", FunctionParameter.NUMBER);
sp4.setName("FVE EMA Thickness");
sp4.setDefault(1);
var sp5 = new FunctionParameter("bEMA", FunctionParameter.STRING);
sp5.setName("EMA Display");
sp5.addOption("On");
sp5.addOption("Off");
sp5.setDefault("Off");
}
var bEdit = true;
var EMA_1 = 0;
var EMA = 0;
var VolumePlusMinusArray = null;
var IntraArray = null;
var InterArray = null;
var TP = 0;
var TP1 = 0;
function main(Samples, Perma, Coef, cFVE, nThickFVE, cEMA, nThickEMA,
bEMA) {
if (bEdit == true) {
setDefaultBarFgColor(cFVE,
0);
setDefaultBarFgColor(cEMA,
1);
setDefaultBarThickness(nThickFVE,
0);
setDefaultBarThickness(nThickEMA,
1);
bEdit = false;
}
var VolumePlusMinus = 0, FVE = 0, Fvesum = 0,
VolSum = 0, FveFactor =
0, Intra = 0, Inter = 0, Vintra = 0,
Vinter = 0, CutOff = 0,
i = 0, K = 2 / (Perma + 1);
var nState = getBarState();
if (IntraArray == null) IntraArray = new Array(Samples);
if (InterArray == null) InterArray = new Array(Samples);
if (VolumePlusMinusArray == null) VolumePlusMinusArray = new
Array(Samples);
if (nState == BARSTATE_NEWBAR) {
IntraArray.pop();
IntraArray.unshift(0);
InterArray.pop();
InterArray.unshift(0);
VolumePlusMinusArray.pop();
VolumePlusMinusArray.unshift(0);
TP1 = TP;
}
IntraArray[0] = Math.log(high(0)) - Math.log(low(0));
InterArray[0] = Math.log((high(0) + low(0) + close(0))/3) - Math.log((high(-1)+
low(-1) + close(-1))/3);
TP = (high(0) + low(0) + close(0))/3;
if (IntraArray[Samples -1] == null) return;
if (InterArray[Samples -1] == null) return;
Intra = Math.log(high(0)) - Math.log(low(0));
Vintra = StandardDev(IntraArray, Samples);
Inter = Math.log(TP) - Math.log(TP1);
Vinter = StandardDev(InterArray, Samples);
CutOff = Coef * (Vintra + Vinter) * close(0);
MF = close(0) - ((high(0) + low(0))/2) + TP - TP1;
if(MF > CutOff)
FveFactor = 1;
else if(MF < -1 * CutOff)
FveFactor = -1;
else
FveFactor=0;
VolumePlusMinus = volume(0) * FveFactor;
VolumePlusMinusArray[0] = VolumePlusMinus;
if (VolumePlusMinusArray[Samples-1] == null) return;
for(i = 0; i < Samples; i++){
Fvesum += VolumePlusMinusArray[i];
VolSum += volume(-i);
}
if(VolumePlusMinusArray[Samples - 1] != null){
FVE = (Fvesum / (VolSum/Samples)) / Samples * 100;
if (nState == BARSTATE_NEWBAR) EMA_1 = EMA;
EMA = K * FVE + (1 - K) * EMA_1;
if (bEMA == "On") {
return new Array(FVE,EMA);
} else {
return new Array(FVE,EMA.toFixed(4));
}
}
return null;
}
function StandardDev(Array,Length){
var i;
var vSum = 0;
var SumSqr = 0;
var StdDev = 0;
for(i = 0; i < Length; i++)
vSum += Array[i];
if(Length != 0)
for(i = 0; i < Length; i++)
SumSqr += (Array[i] - vSum / Length) * (Array[i] - vSum
/ Length);
StdDev = Math.sqrt(SumSqr / Length);
return StdDev;
}
To discuss these studies or download copies of the formulas, please visit the Efs Library Discussion Board forum under the Bulletin Boards link at www.esignalcentral.com.
The other studies used in Katsanos' chart examples -- Bollinger Bands, exponential moving average, directional movement (ADX), and the moving average convergence/divergence (MACD) -- are included in the eSignal Basic Studies list. To apply these studies, go to Chart Options, select "Basic Studies," and select the appropriate studies. Their parameters are also configurable through the Edit Studies feature.
--Jason Keck
eSignal, a division of Interactive Data Corp.
800 815-8256, www.esignalcentral.com
NEUROSHELL TRADER: DETECTING BREAKOUTS
The penny stock breakout system described by Markos Katsanos in his article "Detecting Breakouts In Low-Priced Stocks: Las Vegas Or Los Nasdaq?" can be easily implemented in NeuroShell Trader by combining a few of NeuroShell Trader's 800+ indicators. To recreate the breakout system, select "New Trading Strategy ..." from the Insert menu and enter the following entry and exit conditions in the appropriate locations of the Trading Strategy Wizard:
Generate a buy long MARKET order if ALL of the following are true:
A>B ( FVE(High, Low, Close, Volume, 14) , -1 )
A<B<C ( -0.35, Multiply( Divide( LinRegSlope(Close,35), Lag(Close,35)
), 100 ), 0.4 )
A<B<C ( -0.4, Multiply( Divide( LinRegSlope(Close,70), Lag(Close,70)
), 100 ), 0.4 )
A>B ( Multiply( Divide( LinRegSlope(Close,170), Lag(Close,170) ), 100
), -0.02 )
A>B ( ExpAvgOffset( MACD(Close, 12, 26), 9 ), -.003)
A<B ( SimpleStochastic%K( SDC, 150 ), 20 )
A>B ( Close, ExpAvg(Close,10) )
A<B ( Multiply(SDC , ADX( High, Low, Close, 20, 20 ) ), 1.3 )
A>B ( Stochastic%D( High, Low, Close, 10, 3 ), 30 )
Generate a sell long MARKET order if ONE of the following is true:
A<B ( Close, Multiply ( 0.82, Maximum(Close,2) )
BarsSinceFilled>=X( Trading Strategy, 71 )
Note: The FVE indicator is a custom indicator. It was described in the Traders' Tips section of the September 2003 issue of Technical Analysis of Stocks & Commodities, and is available from the Stocks & Commodities website at https://www.traders.com/Documentation/FEEDbk_docs/Archive/092003/TradersTips/TradersTips.html.
If you have NeuroShell Trader Professional, you can also choose whether the system parameters should be optimized. After backtesting the trading strategy, use the "Detailed Analysis ..." button to view the backtest and trade-by-trade statistics for the penny stock breakout trading system.
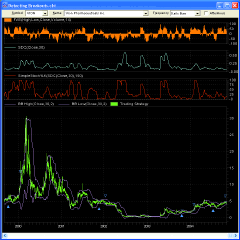
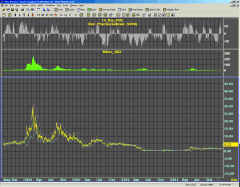
Figure 4: NeuroShell, Trend penny stock breakout system. Here
is a sample Neuroshell chart applying the PSBO system to VIONPharmaceuticals.
Users of NeuroShell Trader can go to the Stocks & Commodities section of the NeuroShell Trader free technical support website to download a sample chart that includes the penny stock breakout trading system (Figure 4).
--Marge Sherald
Ward Systems Group, Inc.
301 662-7950, sales@wardsystems.com
www.neuroshell.com
NeoTicker: DETECTING BREAKOUTS
Three indicators are required to implement in NeoTicker the ideas presented in "Detecting Breakouts In Low-Priced Stocks: Las Vegas Or Los Nasdaq?" by Markos Katsanos in this issue. The first indicator is called SDxADX (Listing 1) with two parameters, Period and D1; this indicator returns two values, SD and SD*ADX. The second is called FVE (Listing 2) with two parameters, Period and Coef; this indicator returns one value, FVE. The third one is the trading system, called sys_penny_breakout (Listing 3). This indicator will return the equity curve of Katsanos' penny breakout system.
NeoTicker can show where the entries and exits are on the chart with up and down arrows (Figures 5 and 6). Detailed results of the system can be obtained through the system performance viewer.
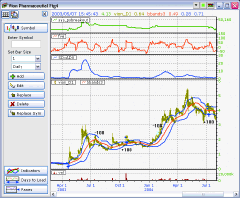
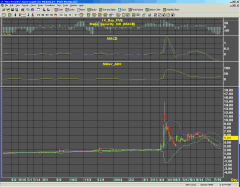
Figure 5: NEOTICKER, VION. Here is Katsanos' penny stock system
on the stock Vion. NeoTicker can show where the entries and exits are on
the chart with up and down arrows.
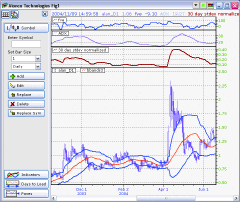
Figure 6: NEOTICKER, ALAN. Here is Katsanos' penny stock system
on the stock Alanco. NeoTicker can show where the entries and exits are
on the chart with up and down arrows.
LISTING 1
$PERIOD := if(param1>80, 80, if(param1<5, 5, param1));
$D1 := if(param2>80, 80, if(param2<5, 5, param2));
plot1 := stddev(data1,$PERIOD)/average(data1, $PERIOD);
plot2 := plot1*qc_ADX.plot3(data1,$D1,$D1);
LISTING 2
$PERIOD := if(param1>80, 80, if(param1<5, 5, param1));
$COEF := if(param2>2, 2, if(param2<0, 0, 0.1));
TP := (h+l+c)/3;
INTRA := ln(h)-ln(l);
VINTRA := stddev(INTRA, $PERIOD);
INTER := ln(TP)-ln(TP(1));
VINTER := stddev(INTER, $PERIOD);
CUTOFF := $COEF*(VINTRA+VINTER)*C;
MF := (c-((h+l)/2))+TP-TP(1);
xFVEFactor := if(MF>CUTOFF, 1, if(MF<(-1*CUTOFF), -1, 0));
volplusminus := v*xFVEFactor;
FVEsum := summation(volplusminus, $PERIOD);
plot1 := (FVEsum/(average(v,$PERIOD)*$PERIOD))*100;
LISTING 3
$MACDH := qc_MACD.Plot1(data1,12,26,"No",9)-qc_MACD.Plot2(data1,12,26,"No",9);
$SUMSDC := summation(SDxADX.Plot1(data1,30,25)-
llv(SDxADX.Plot1(data1,30,25),150),3)/
summation(hhv(SDxADX.Plot1(data1,30,25),150)-
llv(SDxADX.Plot1(data1,30,25),150),3)*100;
$buysignal := fve(data1,14,0.1) > -1 and
linslope(data1,35)/c(35)*100 > -0.35 and
linslope(data1,35)/c(35)*100 < 0.4 and
linslope(data1,70)/c(70)*100 > -0.4 and
linslope(data1,70)/c(70)*100 < 0.4 and
linslope(data1,170)/c(170)*100 > -0.2 and
$MACDH > -0.003 and
$SUMSDC < 20 and
c > qc_xaverage(c,10) and
SDxADX.Plot2(data1,30,25) < 1.3 and
fastd(data1,10,3) > 30;
longatmarket($buysignal>0, 100);
$trialstopsignal := c < (1-18/100)*hhv(c,2);
$Isprofit := OpenPositionBestPriceLevel - OpenPositionAverageEntryPrice;
longexitstop($trialstopsignal>0 and $Isprofit>0, c, 100);
$CurrentPositionAge := if(OpenPositionlong > 0, $CurrentPositionAge+1,
0);
debug("Position Age ", $CurrentPositionAge);
longexitatmarket($CurrentPositionAge > 70, 100);
plot1 := currentequity;
A downloadable version of the system and indicators will be available through the NeoTicker Yahoo! User Group and TickQuest websites.
--Kenneth Yuen, TickQuest Inc.
www.tickquest.com
AIQ: Detecting Breakouts
Here is some Aiq code based on Markos Katsanos' "Detecting Breakouts
In Low-Priced Stocks: Las Vegas Or Los Nasdaq?" in this issue.
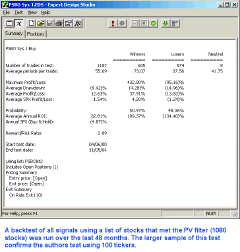
FIGURE 7: AIQ, Penny Stock BreakOout SYSTEM 1 BUY. A backtest
of all signals using a list of stocks that met the PV filter (1,080 stocks)
was run over the last 48 months. The larger sample of this test confirms
the author's test using 100 tickers.
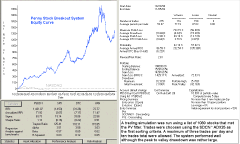
FIGURE 8: AIQ, Penny Stock Breakout SYSTEM equity curve. A trading
simulation was run using a list of 1,080 stocks that met the PV filter.
Trades were chosen using the SDCN*ADX25 as the first sorting criteria.
A maximum of three trades per day and 10 trades total were allowed. The
system performed well, although the peak-to-valley drawdown was rather
large.
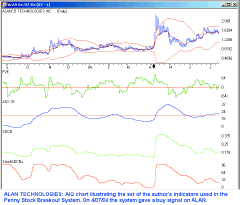
FIGURE 9: AIQ, alanco technologies. Here is an AIQ chart illustrating
Markos Katsanos' indicators used in the penny stock breakout system. On
4/07/2004, the system gave a buy signal on ALAN.
!PENNY STOCK BREAK OUT SYSTEM (PSBO)
!Author: Markos Katsanos, TASC, "Detecting Breakouts", January 2005
!Coded by: Richard Denning 11/07/2004
!DEFINE PARAMETERS:
Define P1 30. !SDCN parameter
Define W1 25. !ADX parameter
Define D2 150. !StochSDCN parameter
Define P2 14. !FVE parameter
Define COEF 0.1. !FVE parameter
Define X1 12.
!MACD parameter
Define X2 25. !MACD parameter
Define X3 9. !MACD parameter
Define S1 10. !Stochastic parameter
Define S2 3. !Smooothing parameter
!CODING ABREVIATIONS:
H is [high].
H1 is val([high],1).
L is [low].
L1 is val([low],1).
C is [close].
C1 is val([close],1).
O is [open].
Typical is (H + L + C) / 3.
Typical1 is valresult(Typical,1).
V is [volume].
!STANDARD DEVIATION OF THE CLOSE
SDC is sqrt(variance(C,P1)).
!NORMALIZED STANDARD DEVIATION OF CLOSE
SDCN is SDC / simpleavg([close],P1).
!STOCHASTIC OF CLOSE:
Stoch is (C - lowresult(C,S1)) / (highresult(C,S1) - lowresult(C,S1))
* 100.
StochS is simpleavg(Stoch,S2).
!STOCHASTIC OF STANDARD DEVIATION OF CLOSE
StochSDCNr is (SDCN - lowresult(SDCN,D2)) / (highresult(SDCN,D2) -
lowresult(SDCN,D2)) * 100.
StochSDCNs is simpleavg(StochSDCNr,S2).
!DMI, ATR & ADX INDICATORS BASED ON WELLS WILDERS FORMULAS:
!Wells Wilder's indicators use a 14 day recursive averaging method
!To convert recursive averaging to exponential averaging use the formula:
!ExponentialPeriods = 2 * WilderPeriod - 1.
F1 is 2 * W1 - 1.
rhigh is H - H1.
rlow is L1 - L.
DMp is iff(rhigh > 0 and rhigh > rlow, rhigh, 0).
DMm is iff(rlow > 0 and rlow >= rhigh, rlow, 0).
AvgDMp is expAvg(DMp,F1).
AvgDMm is expavg(DMm,F1).
TR is Max(H - L,max(abs(C1 - L),abs(C1- H))).
ATR is expAvg(TR,F1).
PlusDMI is (AvgDMp/ATR)*100.
MinusDMI is AvgDMm/ATR*100.
DIdiff is PlusDMI - MinusDMI.
Zero if PlusDMI = 0 and MinusDMI = 0.
DIsum is PlusDMI+MinusDMI.
DX is iff(ZERO,100,abs(DIdiff)/DIsum*100).
ADX is ExpAvg(DX,F1).
!SDCN * ADX:
SDCNADX is SDCN * ADX.
!FINITE VOLUME ELEMENT INDICATOR (FVE):
Intra is ln(H) - ln(L).
Vintra is sqrt(variance(Intra,P2)).
Inter is ln(Typical) - ln(Typical1).
Vinter is sqrt(variance(Inter,P2)).
Cutoff is Coef * (Vinter + Vintra) * C.
MF is C - (H + L) / 2 + Typical - Typical1.
FV is iff(MF > Cutoff, V,iff(MF < Cutoff,-V,0)).
FVE is sum(FV,P2) / simpleavg(V,P2) / P2 * 100.
!MOVING AVERAGE CONVERGENCE DIVERGENCE INDICATOR (MACD):
MACD1 is expavg([Close],X1).
MACD2 is expavg([Close],X2).
MACD is MACD1 - MACD2.
MACDH is MACD - expavg(MACD,X3).
!PRICE, VOLUME AND CAPACITY FILTER (PV)
!Added by Richard Denning, not part of original system
!Assumption: position size to be less than 1% of average volume with
$10K size
PV if C <= 5 and C > 0.10 and VE >= 500 and (10000 / C) / (VE *
100) < 0.05.
VE is expavg(V,50).
!PSBO SYSTEM RULES:
Buy if PV
and hasdatafor(200) >=180
and FVE > -1
and slope2(C,35) / valresult(C,35) * 100 > -0.35
and slope2(C,35) / valresult(C,35) * 100 < 0.40
and slope2(C,70) / valresult(C,70) * 100 > -0.40
and slope2(C,70) / valresult(C,70) * 100 < 0.40
and slope2(C,170) / valresult(C,170) * 100 > -0.20
and MACDH > -0.003
and StochSDCNs < 20
and C > expavg(C,10)
and SDCN * ADX < 1.3
and StochS > 30.
PD is {position days}.
Exit1 if C < highresult(C,PD) * (1 - 0.18) or PD >= 70.
--Richard Denning
www.aiq.com
TRADING SOLUTIONS: DETECTING BREAKOUTS
In his article "Detecting Breakouts In Low-Priced Stocks: Las Vegas Or Los Nasdaq?" in this issue, Markos Katsanos describes his indicators and system for detecting and trading breakouts in penny stocks.
The indicators can be entered as follows:
Name: Normalized Standard Deviation
Short Name: SDC
Inputs: Data, Period (30)
Formula:
Div (StDev (Data, Period), MA (Data, Period))
Name: SD*ADX Composite Indicator
Short Name: SD*ADX
Inputs: Close, High, Low, Period for SD (30), Period for ADX (25)
Formula:
Mult (SDC (Close, Period for SD), ADX (Close, High, Low, Period for
ADX, Period for ADX))
Name: Stochastic on Indicator
Short Name: StochInd
Inputs: Data, Period (150)
Formula:
Stoch (Data, Data, Data, Period, 3)
The finite volume elements (volatility-modified) function was described in the Traders' Tip section of the September 2003 issue of Stocks & Commodities.
The penny stock breakout system can be implemented as follows:
Name: Penny Stock Breakout System
Inputs: Close, High, Low, Volume
Enter Long:
1. GT (FVEVM (Close, High, Low, Volume, 14, 0.1), -1)
2. GT (Mult (Div (Slope (Close, 35), Lag (Close, 35)), 100), -0.35)
3. LT (Mult (Div (Slope (Close, 35), Lag (Close, 35)), 100), 0.4)
4. GT (Mult (Div (Slope (Close, 70), Lag (Close, 70)), 100), -0.4)
5. LT (Mult (Div (Slope (Close, 70), Lag (Close, 70)), 100), 0.4)
6. GT (Mult (Div (Slope (Close, 170), Lag (Close, 170)), 100), -0.2)
7. GT (MACDHist (Close), -0.003)
8. LT (StochInd (SDC (Close, 30), 150, 20)
9. GT (Close, EMA (Close, 10))
10. LT (SD*ADX (Close, High, Low, 30, 25), 1.3)
11. GT (Stoch (Close, High, Low, 10, 3), 30)
Exit Long:
1. LT (Close, Mult (0.82, Highest (Close, 2)))
2. Rule_ExitOnLength (70, 0)
These functions are available in a function file that can be downloaded from the TradingSolutions website (www.tradingsolutions.com) in the Solution Library section. As with many indicators, these values can make good inputs to neural network predictions. The parameters to the entry/exit system could also be made into inputs and be optimized.
--Gary Geniesse
NeuroDimension, Inc.
800 634-3327, 352 377-5144
https://www.tradingsolutions.com
