December 2004
TRADERS' TIPS
You can copy these formulas and programs for easy use in your spreadsheet or analysis software. Simply "select" the desired text by highlighting as you would in any word processing program, then use your standard key command for copy or choose "copy" from the browser menu. The copied text can then be "pasted" into any open spreadsheet or other software by selecting an insertion point and executing a paste command. By toggling back and forth between an application window and the open Web page, data can be transferred with ease.
This month's tips include formulas and programs for:
or return to December 2004 ContentsTRADESTATION: TREND TRIGGER FACTOR
METASTOCK: TREND TRIGGER FACTOR
WEALTH-LAB: TREND TRIGGER FACTOR
AMIBROKER: TREND TRIGGER FACTOR
eSIGNAL: TREND TRIGGER FACTOR
NEUROSHELL TRADER: TREND TRIGGER FACTOR
TRADINGSOLUTIONS: TREND TRIGGER FACTOR
NEOTICKER: TREND TRIGGER FACTOR
PROPHET.NET: TREND TRIGGER FACTOR
AIQ: TREND TRIGGER FACTOR
TECHNIFILTER PLUS: TREND TRIGGER FACTOR
FINANCIAL DATA CALCULATOR: TREND TRIGGER FACTOR
BULLCHARTS: TREND TRIGGER FACTOR
ASPEN GRAPHICS: TREND TRIGGER FACTOR
TRADE NAVIGATOR: TREND TRIGGER FACTOR
SMARTRADER: TREND TRIGGER FACTOR
INVESTOR/RT: TREND TRIGGER FACTOR
STOCKWIZ: TREND TRIGGER FACTOR
TRADESTATION: TREND TRIGGER FACTOR
In the article "Trend Trigger Factor" in this issue, M.H. Pee describes a trend trigger factor (TTF) indicator, which is a method of detecting uptrends and downtrends using a 15-day buy power and 15-day sell power calculation. Pee also provides sample criteria that can be used to create an always-in-the-market reversal strategy based on the TTF indicator.
Here, we provide sample EasyLanguage code for a TTF PaintBar study and strategy.
The TTF PaintBar colors a bar green when the 15-day TTF value is greater than 100 (Figure 1). This is intended to indicate an uptrending market. When the TTF value is less than -100, the bars are painted red. This is intended to indicate a downtrending market. Bars that have TTF values between 100 and -100 are painted yellow. This is intended to indicate a consolidating market.

FIGURE 1: TRADESTATION, TREND TRIGGER FACTOR. Here is a sample chart showing the trend trigger factor, based on M.H. Pee's article in this issue.
PaintBar:  TrendTriggerFactor
inputs:
 Length( 15 ) ;
variables:
 BuyPower( 0 ) ,
 SellPower( 0 ) ,
 TTF( 0 ) ;
BuyPower = Highest( High , Length ) - Lowest( Low ,
 Length )[Length] ;
SellPower = Highest( High , Length )[Length] -
 Lowest( Low , Length ) ;
TTF = ( ( BuyPower - SellPower ) / ( 0.5 * ( BuyPower +
 SellPower ) ) ) * 100 ;
if TTF > 100 then
 PlotPaintBar( High, Low , "TTF", Green )
else if TTF < -100 then
 PlotPaintBar( High, Low, "TTF", Red )
else
 PlotPaintBar( High, Low, "TTF", Yellow ) ;
Strategy:  TrendTriggerFactor
inputs:
 Length( 15 ) ;
variables:
 BuyPower( 0 ) ,
 SellPower( 0 ) ,
 TTF( 0 ) ;
BuyPower = Highest( High , Length ) - Lowest( Low ,
 Length )[Length] ;
SellPower = Highest( High , Length )[Length] -
 Lowest( Low , Length ) ;
TTF = ( ( BuyPower - SellPower ) / ( 0.5 * ( BuyPower +
 SellPower ) ) ) * 100 ;
if TTF crosses over 100 then
 Buy next bar at market
else if TTF crosses under -100 then
 Sell short next bar at market ;
An .eld file containing the EasyLanguage code for the TTF PaintBar
and strategy will be available for download at www.tradestationworld.com.
--Mitch Shack
EasyLanguage Questions Forum
TradeStation Securities, Inc.
A subsidiary of TradeStation Group, Inc.
www.TradeStationWorld.com
METASTOCK: TREND TRIGGER FACTOR
M.H. Pee's article in this issue, "Trend Trigger Factor," introduces an indicator of the same name. Here, we present the formula for this indicator and the steps to include it in MetaStock.
To enter this indicator into MetaStock:
1. In the Tools menu, select Indicator Builder.
2. Click New to open the Indicator Editor for a new indicator.
3. Type the name of the formula.
4. Click in the larger window and type in the following formula:
Name:  Trend Trigger Factor
Formula:
x:=Input("number of periods",2,100,15);
bp:=HHV(H,x)-Ref(LLV(L,x),-x);
sp:=Ref(HHV(H,x),-x)-LLV(L,x);
((bp-sp)/(0.5*(bp+sp)))*100
Since Pee's article also included the signals to trade this indicator,
it is possible to construct a system test and an expert advisor for it.
These formulas and the procedure for creating them follow.
To create the system test:
1. In the Tools menu, select the Enhanced System Tester
2. Click New to open the system tester editor
3. Select the "Buy order" tab and insert this formula:
x:=15;
bp:=HHV(H,x)-Ref(LLV(L,x),-x);
sp:=Ref(HHV(H,x),-x)-LLV(L,x);
ttf:=((bp-sp)/(0.5*(bp+sp)))*100;
Cross(ttf,100)
4. Select the "Sell order" tab and insert this formula:
x:=15;
bp:=HHV(H,x)-Ref(LLV(L,x),-x);
sp:=Ref(HHV(H,x),-x)-LLV(L,x);
ttf:=((bp-sp)/(0.5*(bp+sp)))*100;
Cross(-100,ttf)
5. Select the "Sell short order" tab and insert this formula:
x:=15;
bp:=HHV(H,x)-Ref(LLV(L,x),-x);
sp:=Ref(HHV(H,x),-x)-LLV(L,x);
ttf:=((bp-sp)/(0.5*(bp+sp)))*100;
Cross(-100,ttf)
6. Select the "Buy to cover order" tab and insert this formula:
x:=15;
bp:=HHV(H,x)-Ref(LLV(L,x),-x);
sp:=Ref(HHV(H,x),-x)-LLV(L,x);
ttf:=((bp-sp)/(0.5*(bp+sp)))*100;
Cross(ttf,100)
7. Click OK to close the editor.
To create the expert advisor:
1. In the Tools menu, select the Expert Advisor
2. Click New to open the expert editor
3. Select the Highlights tab
4. Click New to make a new highlight
5. Enter the name as: Long
6. Set the color to: Green
7. Enter the following formula for the condition:
x:=15;
bp:=HHV(H,x)-Ref(LLV(L,x),-x);
sp:=Ref(HHV(H,x),-x)-LLV(L,x);
ttf:=((bp-sp)/(0.5*(bp+sp)))*100;
ttf>100
8. Click OK to close the highlight editor.
9. Repeat steps 4 through 8 to make the short highlight listed below:
Name:       Short
Color:       Red
Condition:
x:=15;
bp:=HHV(H,x)-Ref(LLV(L,x),-x);
sp:=Ref(HHV(H,x),-x)-LLV(L,x);
ttf:=((bp-sp)/(0.5*(bp+sp)))*100;
ttf<-100
10. Select the "Symbols" tab
11. Click New to make a new symbol
12. Enter the name as "Buy"
13. Enter the following formula for the condition:
x:=15;
bp:=HHV(H,x)-Ref(LLV(L,x),-x);
sp:=Ref(HHV(H,x),-x)-LLV(L,x);
ttf:=((bp-sp)/(0.5*(bp+sp)))*100;
Cross(ttf,100)
14. Select the "Graphics" tab
15. Set the symbol to the up arrow and the color to green
16. Click OK to close the symbol editor
17. Repeat steps 11-16 to make the sell symbol listed below:
Name:        Sell
Condition:
x:=15;
bp:=HHV(H,x)-Ref(LLV(L,x),-x);
sp:=Ref(HHV(H,x),-x)-LLV(L,x);
ttf:=((bp-sp)/(0.5*(bp+sp)))*100;
Cross(-100,ttf)
Symbol:      Sell Arrow
Color:       Red
18. Click OK to close the expert editor.
--William GolsonGO BACK
Equis International
WEALTH-LAB: TREND TRIGGER FACTOR
We wrapped up the trend trigger factor into a custom indicator, TTF, which is now part of the Wealth-Lab Library integrated with Wealth-Lab Developer through the Community|Download action. Visitors to www.wealth-lab.com are invited to run the ChartScript shown below, which incorporates the TTF indicator and the trading rules presented in the article by M.H. Pee. To do so, click "ChartScripts" in the site's main menu and follow the link to Search for ChartScripts by name. Enter "TTF," select the script, enter a symbol, and click "Execute" (Figure 2).

FIGURE 2: WEALTH-LAB, TREND TRIGGER FACTOR. It's typical for pure trend-following systems to have periods of extraordinary gains, but many trades result in losses due to whipsaws during nontrending periods. The highlighted regression channel is drawn automatically by the ChartScript.
Due to rather dismal simulation results when trading the Dow 30 stocks
over the past eight years, we've prepared the ChartScript for optimization
on the TTF period and crossing value for further experimentation by Wealth-Lab
users. Notwithstanding, the TTF ChartScript performed quite well on the
cubes (QQQ) since their inception in 1999. Putting $10,000 to work on QQQ
in a $imulation beginning in March 1999 returned $8,954 in profits after
deducting $15/trade commissions -- that's more than a 12% annualized gain.
Wealth-Lab script code:
{$I 'TTF'}
{#OptVar1 15;7;17;2}
{#OptVar2 100;20;120;10}
var Bar, p, Period, XOver, hTTF, TTFPane, StBar, EndBar: integer;
var StPnt, EnPnt, Diff, MaxDiff: float;
Period := #OptVar1;
XOver := #OptVar2;
{ Calculate TTF and plot }
hTTF := TTFSeries( Period );
TTFPane := CreatePane( 100, true, true );
DrawHorzLine( XOver, TTFPane, 0, #Dotted );
DrawHorzLine( -XOver, TTFPane, 0, #Dotted );
PlotSeriesLabel( hTTF, TTFPane, #Blue, #Thick, 'TTF' );
HideVolume; PlotStops;
for Bar := 2 * Period to BarCount - 1 do
begin
  case MarketPosition of
    0:    { No position }
      if CrossOverValue( Bar, hTTF, XOver ) then
        BuyAtMarket( Bar + 1, '' )
      else if CrossUnderValue( Bar, hTTF, -XOver ) then
        ShortAtMarket( Bar + 1, '' );
    1:    { Current position is long }
      if CrossUnderValue( Bar, hTTF, -XOver ) then
      begin
        SetBackgroundColor( Bar, #RedBkg );
        SellAtMarket( Bar + 1, LastPosition, IntToStr( -XOver ) );
        ShortAtMarket( Bar + 1, '' );
      end;
    -1:   { Current position is short }
      if CrossOverValue( Bar, hTTF, XOver ) then
      begin
        SetBackgroundColor( Bar, #GreenBkg );
        CoverAtMarket( Bar + 1, LastPosition, IntToStr( XOver ) );
        BuyAtMarket( Bar + 1, '' );
      end;
  end;
end;
{ Highlight the regression channel of winning trades }
for p := 0 to PositionCount - 1 do
  if PositionProfit( p ) > 0 then
  begin
    StBar := PositionEntryBar( p );
    EndBar := PositionExitBar( p );
    if EndBar = 0 then EndBar := BarCount - 1;
    StPnt := LinearRegLine( #Close, StBar, EndBar, StBar );
    EnPnt := LinearRegLine( #Close, StBar, EndBar, EndBar );
    MaxDiff := 0;
    for Bar := StBar to EndBar do
    begin
      Diff := Abs( PriceClose( Bar ) - LinearRegLine( #Close, StBar, EndBar, Bar ) );
      MaxDiff := Max( Diff, MaxDiff );
    end;
    DrawDiamond( StBar, StPnt - MaxDiff, StBar, StPnt + MaxDiff, EndBar,
      EnPnt + MaxDiff, EndBar, EnPnt - MaxDiff, 0, 898, #Thin, 898, true );
  end;
--Robert SucherGO BACK
www.wealth-lab.com
AMIBROKER: TREND TRIGGER FACTOR
In "Trend Trigger Factor," M.H. Pee introduces a simple trend-following indicator that can be easily implemented using AmiBroker Formula Language.
The code in Listing 1 plots the trend trigger factor (TTF) indicator.
The code also includes simple trading rules that were presented in the
article so it can be applied in Automatic Analysis window and tested for
historical performance. It should be noted that original trigger levels
do not always work best for all securities, so one would need to find optimum
parameters for best performance. The code in Listing 1 already includes
optimization.
LISTING 1
function TTF( periods )
{
  BuyPower = HHV( High, periods ) - Ref( LLV( Low, periods ), - periods );
  SellPower = Ref( HHV( High, periods ), - periods ) - LLV( Low, periods );
  return 100 * (BuyPower - SellPower) / ( 0.5*( BuyPower + SellPower) );
}
ttf15 = TTF( 15 );
Plot( ttf15, "TTF(15)", colorRed );
bt = Optimize( "Buy Trigger", 100, 0, 120, 5 );
st = Optimize( "Sell Trigger", -100, -120, 0, 5 );
/* system rules */
Buy = Cross( ttf15, bt );
Sell = Cross( -st, ttf15 );
/* reverse positions */
Short = Sell;
Cover = Buy;
The screenshot in Figure 3 shows an AmiBroker-generated, three-dimensional
optimization chart of the TTF system performance over the last four years
when applied to the QQQ. As we can see, the TTF-based system presents a
relatively high sensitivity to buy/sell trigger levels. This suggests that
a TTF-based system is not as robust as we may think at first look.

FIGURE 3: AMIBROKER, TREND TRIGGER FACTOR. This screenshot shows a three-dimensional optimization chart of the TTF system performance over the last four years when applied to the QQQ. As we can see, the TTF-based system presents a relatively high sensitivity to buy/sell trigger levels. This suggests that the TTF-based system is not as robust as we may think at first look.
--Tomasz Janeczko, AmiBroker.comGO BACK
www.amibroker.com
eSIGNAL: TREND TRIGGER FACTOR
Here, we present the eSignal EFS code based on the article "Trend Trigger Factor" by M.H. Pee in this issue. A sample eSignal chart is shown in Figure 4.

FIGURE 4: eSIGNAL TREND TRIGGER FACTOR. Here is a demonstration of the trend trigger factor (TTF) indicator in eSignal.
GO BACK/***************************************************************** Provided By : eSignal. (c) Copyright 2004 Study: Trend Trigger Factor (TTF) by M.H. Pee Version: 1.0 10/6/2004 Notes: Formula Parameters: Default: TTF Length 15 TTF Thickness 2 *****************************************************************/ function preMain() { setStudyTitle("Trend Trigger Factor "); setCursorLabelName("TTF", 0); setDefaultBarThickness(2, 0); setShowTitleParameters(false); addBand(100, PS_SOLID, 2, Color.red, "upper"); addBand(0, PS_SOLID, 2, Color.grey, "zero"); addBand(-100, PS_SOLID, 2, Color.blue, "lower"); var fp1 = new FunctionParameter("nLength", FunctionParameter.NUMBER); fp1.setName("TTF Length"); fp1.setLowerLimit(1); fp1.setDefault(15); var fp2 = new FunctionParameter("nThick", FunctionParameter.NUMBER); fp2.setName("TTF Thickness"); fp2.setLowerLimit(1); fp2.setDefault(2); } var bEdit = true; var nHighBP = null; var nHighSP = null; var nLowBP = null; var nLowSP = null; var aHigh = null; var aLow = null; var nTTF = null; function main(nLength, nThick) { if (bEdit == true) { setDefaultBarThickness(nThick, 0); if (aHigh == null) aHigh = new Array(nLength*2); if (aLow == null) aLow = new Array(nLength*2); bEdit = false; } var nH = high(0); var nL = low(0); if (getBarState() == BARSTATE_NEWBAR) { nHighBP = null; nHighSP = null; nLowBP = null; nLowSP = null; aHigh.pop(); aHigh.unshift(nH); aLow.pop(); aLow.unshift(nL); for (i = 0; i < (nLength*2); i++) { if (i == 0) { nHighBP = aHigh[i]; nLowSP = aLow[i]; } if (i == nLength) { nHighSP = aHigh[i]; nLowBP = aLow[i]; } // Buy Power High, Sell Power Low if (i < nLength) { nHighBP = Math.max(nHighBP, aHigh[i]); nLowSP = Math.min(nLowSP, aLow[i]); } // Buy Power Low, Sell Power High if (i >= nLength) { nHighSP = Math.max(nHighSP, aHigh[i]); nLowBP = Math.min(nLowBP, aLow[i]); } } } aHigh[0] = nH; aLow[0] = nL; nHighBP = Math.max(nHighBP, aHigh[0]); nLowSP = Math.min(nLowSP, aLow[0]); if (close((-nLength*2)) == null) return; var nBuyPower = (nHighBP - nLowBP); var nSellPower = (nHighSP - nLowSP); nTTF = ((nBuyPower - nSellPower) / (0.5 * (nBuyPower + nSellPower))) *100; // Colors if (nTTF <= -100) { setBarFgColor(Color.red, 0); } else if (nTTF < 0 && nTTF > -100) { setBarFgColor(Color.maroon, 0); } else if (nTTF >= 0 && nTTF < 100) { setBarFgColor(Color.navy, 0); } else if (nTTF >= 100) { setBarFgColor(Color.blue, 0); } return nTTF; }
--Jason Keck
eSignal, a division of Interactive Data Corp.
800 815-8256, www.esignalcentral.com
NEUROSHELL TRADER: TREND TRIGGER FACTOR
The trend trigger factor (TTF) indicator described by M.H. Pee can be
easily implemented in NeuroShell Trader by combining a few of NeuroShell
Trader's 800+ indicators. To implement TTF, select "New Indicator ..." from
the Insert menu and use the Indicator Wizard to create each of the following:
BUYPOWER:
    Subtract ( PriceHigh (High, 15), Lag (PriceLow(Low,15), 15 ) )
SELLPOWER:
    Subtract ( Lag (PriceHigh (High, 15), 15 ),  PriceLow(Low,15) )
TREND TRIGGER FACTOR:
    Divide ( Subtract (BUYPOWER, SELLPOWER), Multiply ( 0.5, Add2(BUYPOWER, SELLPOWER) ) )
To create the TTF trading system, select "New Trading Strategy ..." from the Insert menu and enter
 the following entry and exit conditions in the appropriate locations of the Trading Strategy Wizard:
Generate a buy long MARKET order if ALL of the following are true:
 A>B ( TREND TRIGGER FACTOR, 100 )
Generate a sell short MARKET order if ALL of the following are true:
 A<B ( TREND TRIGGER FACTOR, -100 )
If you have NeuroShell Trader Professional, you can also choose
whether the system parameters should be optimized. After backtesting the
trading strategy, use the "Detailed Analysis ..." button to view the backtest
and trade-by-trade statistics for the trend trigger factor trading system.
Users of NeuroShell Trader can go to the STOCKS & COMMODITIES section of the NeuroShell Trader free technical support website to download a sample chart (Figure 5) that includes the trend trigger factor indicator and system.

FIGURE 5: NEUROSHELL, TREND TRIGGER FACTOR CHART AND TRADING SYSTEM. This NeuroShell Trader chart displays the trend trigger factor described by M.H. Pee.
--Marge Sherald, Ward Systems Group, Inc.GO BACK
301 662-7950, sales@wardsystems.com
www.neuroshell.com
TRADINGSOLUTIONS: TREND TRIGGER FACTOR
In his article "Trend Trigger Factor," M.H. Pee introduces his trend trigger factor indicator, which detects whether a price series is currently in an upward trend, a downward trend, or staying even.
This indicator can be implemented in TradingSolutions as follows:
Name: TTF Buy Power
Short Name: TTFBuyPower
Inputs: High, Low, Period (15)
Formula:
Sub (Highest (High, Period), Lag (Lowest (Low, Period),Period))
Name: TTF Sell Power
Short Name: TTFSellPower
Inputs: High, Low, Period (15)
Formula:
Sub (Lag (Highest (High, Period), Period), Lowest (Low, Period))
Name: Trend Trigger Factor
Short Name: TTF
Inputs: High, Low, Period (15)
Formula:
Mult (Div (Sub (TTFBuyPower (High, Low, Period), TTFSellPower (High, Low, Period)), Mult (0.5,
 Add (TTFBuyPower (High, Low, Period), TTFSellPower (High, Low, Period)))),100)
The article also mentions trading based on when this indicator crosses
certain values. This system can be implemented in TradingSolutions as follows
(Figure 6):

FIGURE 6: TRADINGSOLUTIONS, TREND TRIGGER FACTOR. Here is a sample TradingSolutions chart displaying the trend trigger factor and associated signal.
Name: Trend Trigger Factor System
Inputs: High, Low, Period (15), Threshold (100)
Enter Long:
GT ( TTF ( High, Low, Period ) , Threshold )
Enter Short:
LT ( TTF ( High, Low, Period ) , Negate ( Threshold ))
These functions are available in a function file that can be downloaded
from the TradingSolutions website in the Solution Library section. As with
many indicators, these values can make good inputs to neural network predictions.
The parameters to the entry/exit system can also be optimized in TradingSolutions;
however, the author appears to argue against doing this to maintain the
robustness of the system.
--Gary Geniesse
NeuroDimension, Inc.
800 634-3327, 352 377-5144
https://www.tradingsolutions.com
NEOTICKER: TREND TRIGGER FACTOR
To implement in NeoTicker the concept presented in "Trend Trigger Factor" by M.H. Pee, first create an indicator named "TTF" with one integer parameter, named period (Listing 1). Next, use the NeoTicker power indicator Backtest EZ to generate the hypothetical testing results.
To create the hypothetical testing system as described in the article using the Backtest EZ indicator, first enter the formula code (Listing 2) in the long and short entry parameters accordingly. After setting up the correct commission size for the testing instrument at the "System" tab, apply the system on the testing data to get the resulting equity curve (Figure 7).

FIGURE 7: NEOTICKER, TREND TRIGGER FACTOR. After setting up the correct commission size for the testing instrument at the System tab, apply the system on the test data to get the resulting equity curve.
Listing 1
$mycounter := $mycounter+1;
$buypower  := hhv(high, param1) - llv(param1, low, param1);
$sellpower := hhv(param1, high, param1) - llv(low, param1);
success1 := if($mycounter > 2*param1, 1, 0);
plot1 := (($buypower-$sellpower)/(0.5*($buypower+$sellpower)))*100;
Listing 2
Long Entry: xaboveconstant(ttf(data1, 15), 100)
Short Entry: xbelowconstant(ttf(data1, 15), 100)
A downloadable version of the TTF indicator will be available
from the Yahoo! NeoTicker User Group.
--Kenneth Yuen, TickQuest Inc.GO BACK
www.tickquest.com
PROPHET.NET: TREND TRIGGER FACTOR
The trend trigger factor, described by M.H. Pee in his article in this issue, is available on the Prophet.net website (https://www.Prophet.net) to all premium members. No coding is required on the part of the user. The indicator is built into the JavaCharts applet.
M.H. Pee's trend trigger factor indicator identifies trending components
of the markets. It aims to identify uptrend and downtrend opportunities
by scaling the difference between extreme highs and lows of two equal time
ranges. For one-click access to the indicator, go to JavaCharts from your
computer's browser:
https://www.prophet.net/analyze/javacharts.jsp
Alternatively, you can click the Analyze tab at the Prophet.net
website and then click the JavaCharts selection (Prophet.net: Analyze:
JavaCharts).
Click on the Tools menu -- also accessible by right-clicking anywhere on the chart -- and choose "Apply Studies" from the Studies menu item. The list of available studies (approximately 150, shown in alphabetical order) is in the second dropdown menu; you can choose the trend trigger factor from this list.
When using the trend trigger factor in JavaCharts, you can customize the bar period. The bar period is the length of each of the two time-period inputs to the trend trigger factor. A default bar period value of 15 is provided; this is the period length tested in the Pee article, so you should only change this parameter if you would like to customize the indicator.
In the example shown in Figure 8, Intel's steady rise during the market bubble in the late 1990s is clearly indicated by the trend trigger factor. An upward-pointing arrow appears on the lower panel in early July 1999, when the trend trigger factor crossed a value of 100. This marks the upward trend and is followed by a two-month rise in Intel's stock price.

FIGURE 8: PROPHET, TREND TRIGGER FACTOR. Intel's steady rise during the market bubble in the late 1990s is clearly indicated by the trend trigger factor. An upward-pointing arrow appears on the lower panel in early July 1999, when the trend trigger factor crossed a value of 100.
Full access to the JavaCharts study set requires a premium membership at Prophet.net. Premium memberships start at $14.95 per month; real-time market data is available for equities, options, and futures. A trial subscription is available by following this link, which will provide immediate access to all features and studies: https://www.prophet.net/tasc.
--Jai SaxenaGO BACK
Prophet Financial Systems, Inc.
650 322-4183 ext. 107
jai@prophet.net
AIQ: TREND TRIGGER FACTOR
This AIQ code is based on "Trend Trigger Factor" by M.H. Pee. Sample charts are shown in Figure 9 and 10.

FIGURE 9: AIQ, TREND TRIGGER FACTOR. Here is an equity curve of the long side of M.H. Pee's trend trigger factor system, based on Nasdaq 100 stocks, shown with trade-by-trade statistics.
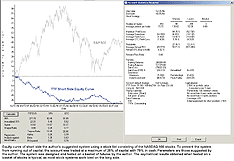
FIGURE 10: AIQ, TREND TRIGGER FACTOR SYSTEM. Here is an equity curve of the short side of M.H. Pee's trend trigger factor system, shown with trade-by-trade statistics, based on Nasdaq 100 stocks. To prevent the system from running out of capital, the account was traded at a maximum of 25% of capital with 75% in cash. The asymmetrical results obtained when tested on a basket of stocks are typical, as most stock systems work best on the long side.
GO BACK!TREND TRIGGER FACTOR !Author: M. H. Pee, "Technical Analysis of Stocks & Commodities", Dec., 2004 !Coded by: Richard Denning 10/06/04 !PARAMETER VALUES FOR TTF N is 15. L is 100. E is -100. S is -100. C is 100. !N-DAY BUY POWER BuyPowerN is hival([high],N,0) - loval([low],N,N). !N-DAY SELL POWER SellPowerN is hival([high],N,N) - loval([low],N,0). !TREND TRIGGER FACTOR TTFn is (BuyPowerN - SellPowerN) / (0.5 * (BuyPowerN + SellPowerN)) * 100. !TTF SYSTEMS RULES !Long Entry LE if TTFn > L and valrule(TTFn < L,1). !Long Exit LX if TTFn < E. !Short Sale Entry SSE if TTFn < S and valrule(TTFn > S,1). !Cover Short Exit CSX if TTFn > C. !RANKING INDICATOR !Use TTF or ADX or Relative Strength ADXrank is [ADX]. TTFrank is TTFn.
-- Richard Denning
www.aiq.com
TECHNIFILTER PLUS: TREND TRIGGER FACTOR
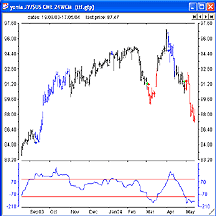
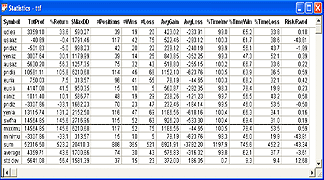
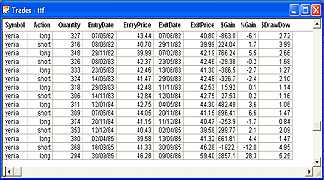
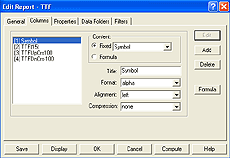
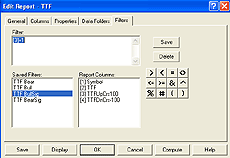
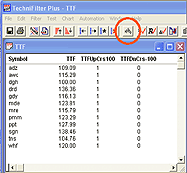
Here are the TechniFilter Plus formulas that recreate the indicators given in "Trend Trigger Factor" by M.H. Pee in this issue. Included here are the TechniFilter formulas; a Market Scan (filter report) to locate issues signaling the start and existence of a TTF; and a strategy test. A sample chart is shown in Figure 11.
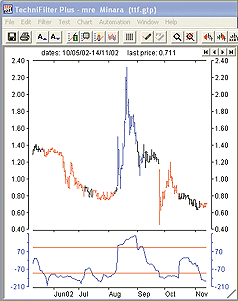
FIGURE 11A: TECHNIFILTER PLUS, TREND TRIGGER FACTOR. Here is a sample chart of the trend trigger factor (TTF) indicator, which can help show the start of a trend.
Formulas
NAME: TTF_TrendTriggerFactor
SWITCHES: multiline
PARAMETERS: 15
FORMULA: [1]: HM&1-LN&1Y&1  {BP}
[2]: HM&1Y&1-LN&1  {SP}
[3]: (([1]-[2])/(0.5*([1] + [2])))*100
FIGURE 11B: NAME: TTFBuyPower PARAMETERS: 15 FORMULA: HM&1-LN&1Y&1 NAME: TTFSellPower PARAMETERS: 15 FORMULA: HM&1Y&1-LN&1FIGURE 11C: NAME: ColorBar_TTFBull SWITCHES: multiline PARAMETERS: 15 FORMULA: [1]: HM&1-LN&1Y&1 {BP} [2]: HM&1Y&1-LN&1 {SP} [3]: (([1]-[2])/(0.5*([1] + [2])))*100 [4]: (IF_THEN([3]>100,1,-1))U2FIGURE 11D: NAME: ColorBar_TTFBear SWITCHES: multiline PARAMETERS: 15 FORMULA: [1]: HM&1-LN&1Y&1 {BP} [2]: HM&1Y&1-LN&1 {SP} [3]: (([1]-[2])/(0.5*([1] + [2])))*100 NAME: ttf TEST TYPE: percentage DATE RANGE: all ENTRY FEE: 75 EXIT FEE: 75FIGURE 11E: FORMULAS-------- [1] Date [2] TTF_TrendTriggerFactor(15) [1]: HM&1-LN&1Y&1 {BP} [2]: HM&1Y&1-LN&1 {SP} [3]: (([1]-[2])/(0.5*([1] + [2])))*100 [3] Long ([2]-100)U2-Ty1 [4] Short [1]: -100 [2]: ([[2]]-[1])U2-Ty1FIGURE 11F: RULES-------- r1: GoLong buy long all on Next Open at signal: GoLong [3] = 1 r2: StopLong stop long 1 on Close at signal: StopLOng [4]=-1 r3: GoShort open short all on Next Open at signal: GoShort [4] = -1 r4: StopShort cover short 1 on Next Open at signal: StopShort [3]=1 NAME: TTF UNITS TO READ: 100FIGURE 11G: FORMULAS [1] Symbol [2] TTF(15) [1]: HM&1-LN&1Y&1 {BP} [2]: HM&1Y&1-LN&1 {SP} [3]: (([1]-[2])/(0.5*([1] + [2])))*100 [3] TTFUpCrs100 [1]: 100 [2]: [[2]] [3]: ([2]-[1])U2-Ty1 [4] TTFDnCrs-100 [1]: -100 [2]: [[2]] [3]: ([2]-[1])U2-Ty1 FILTERS [1] TTF Bear [2]<= -100 [2] TTF Bull [2] >=100 [3] TTF BullSig [3]=1 [4] TTF BearSig [4] = -1
Visit the TechniFilter Plus website to download these reports, strategy
backtests, and formulas.
--Benzie Pikoos, BrightsparkGO BACK
+61 8 9375-1178
sales@technifilter.com
www.technifilter.com
FINANCIAL DATA CALCULATOR: TREND TRIGGER FACTOR
Financial Data Calculator (FDC) can easily reproduce the trend trigger factor (TTF) described by M.H. Pee in his article in this issue. For testing purposes, it is easiest to make a macro (or two), so the TTF can be used widely.
First, let's create the exact one described in the article, namely that
based on a 15-day period. That macro is constructed by the following language:
@ TTF15 or 15-day Trend Trigger Factor of M. H. Pee
@ syntax: TTL15 dataset
a: ((15 movmax hi #R) back 15) - (15 movmin lo #R)
b: (15 movmax hi #R) - ((15 movmin lo #R) back 15)
((a - b) / (.5 * (a +b))) * 100
To calculate a Ttf 15 for the Spx, all one has to do is enter:
TTF15 SPX
However, it is more likely that the user will experiment with different
periods, or possibly even wish to make the period adaptive. In that case,
it is best to let a variable (the left argument or "#L") specify the period.
That macro language is as follows:
Then, to calculate a 17-day TTF on QQQ, enter:@ TTF_L or L-day Trend Trigger Factor of M. H. Pee @ syntax: (number of days) TTFL dataset a: ((#L movmax hi #R) back #L) - (#L movmin lo #R) b: (#L movmax hi #R) - ((#L movmin lo #R) back #L) ((a - b) / (.5 * (a +b))) * 100
17 TTF_L QQQ
The ability to change the left argument (the "17" above) enables
one to test and optimize over many possible choices. Furthermore, this
left argument does not have to be a constant, but can also be a dataset,
providing unlimited possibilities.
-- William Rafter, president, 856 857-9088GO BACK
Mathematical Investment Decisions Inc.
(formerly Futures Software Associates)
www.financialdatacalculator.com
BULLCHARTS: TREND TRIGGER FACTOR
In this issue, M.H. Pee presents the "Trend Trigger Factor" to assess the viability of a trend by examining the relative size of upward and downward movements. He proposes that a long position should be considered when the trend trigger factor (TTF) exceeds 100, and a short position when it falls below -100.
The Ttf can be easily added to BullCharts by using the BullScript language. The script also highlights entry points using the rules suggested above. To add the TTF indicator, follow these steps:
1. Select "Indicator Builder," located in the "Tools" menu.
2. Press the New button to create a new indicator.
3. Enter the formula name Trend Trigger Factor
4. Enter the BullScript shown below and press OK.
{TheTrend Trigger Factor indicator}
[citation="Stocks & Commodities, Dec 04 - Trend Trigger Factor by M.H.Pee"]
[horzline=100,0,-100]
n := input("Time periods",15,1);
buypow := highest(H,n)-hist(lowest(L,n),n);
sellpow := hist(highest(H,n),n)-lowest(L,n);
ttf := 100*(buypow-sellpow)/(0.5*(buypow+sellpow));
[name=TTF]
ttf;
[name=Long; linestyle=marker; marker=long]
cross(ttf,100);
[name=Short; linestyle=marker; marker=short]
cross(-100,ttf);
Alternatively, a ribbon can be used to show the results of the TTF
indicator without requiring as much room on the screen. The ribbon described
in Listing 2 will draw a green ribbon labeled "Long" when the TTF is above
100, a pink ribbon labeled "Short" when the Ttf is below -100, and a gray
"Hold" ribbon at all other times. A sample chart is shown in Figure 12.
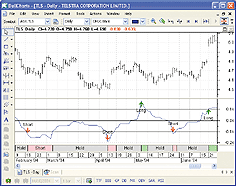
FIGURE 12: BULLSYSTEMS, TREND TRIGGER FACTOR. The trend trigger factor assesses the viability of a trend by examining the relative size of upward and downward movements. In this sample BullCharts chart, a green ribbon labeled "Long" is displayed when the TTF is above 100; a pink ribbon labeled "Short" is displayed when the Ttf is below -100; a gray "Hold" ribbon is displayed at all other times.
{The Trend Trigger Factor ribbon}
[citation="Stocks & Commodities, Dec 04 - Trend Trigger Factor by M.H.Pee"]
[target=Ribbon]
n := input("Time periods",15,1);
buypow := highest(H,n) - hist(lowest(L,n),n);
sellpow := hist(highest(H,n),n) - lowest(L,n);
ttf := 100*(buypow-sellpow)/(0.5*(buypow+sellpow));
[color=LightGreen; name=Long]
ttf>100;
[color=Pink; name=Short]
ttf<-100;
[color=LightGray; name=Hold]
true;
--Peter Aylett, BullSystemsGO BACK
www.bullsystems.com
ASPEN GRAPHICS: TREND TRIGGER FACTOR
M.H. Pee's article, "Trend Trigger Factor," discusses the indicator
of the same name. The formula used to produce this indicator is easily
written in the Aspen 4.0 multiline formula writer. Along with the formula
for the trend trigger factor, we have also included a formula for a chart
overlay that produces the buy and sell signals described by Pee from the
section in the article titled "Interpreting The TTF."
(series,Days=15)=begin
retval=0
BuyPower=0
SellPower=0
BuyPower  = rmax($1.high,Days)
rangemin($1.low,Days+1,Days*2)
SellPower =  rangemax($1.high,Days+1,Days*2)-rmin($1.low,Days)
retval =  (BuyPower-SellPower)/(.5*(BuyPower+SellPower))*100
retval
end
TTF_Text(input)=begin
retval = ' '
if  TrendTriggerFactor($1) >= 100 and TrendTriggerFactor($1)[1] < 100 then
  retval ='Long   ' | vertical | arrow | above | fsmall
if  TrendTriggerFactor($1) <= -100 and TrendTriggerFactor($1)[1] > -100 then
  retval = '  Short' | vertical | arrow  | below |  fsmall
retval
end
The preformatted Aspen page shown in Figure 13, along with
both formulas, are available by contacting Aspen Research Group.
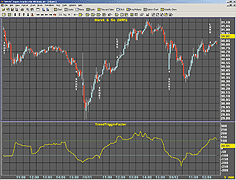
FIGURE 13: ASPEN GRAPHICS, TREND TRIGGER FACTOR CHART. Here's a sample Aspen Software chart displaying the trend trigger factor.
--Keli HarrisonGO BACK
Aspen Research Group
support@aspenres.com
www.aspenresearch.com
TRADE NAVIGATOR: TREND TRIGGER FACTOR
In Trade Navigator Gold and Platinum versions, you can create custom functions to display on the chart as indicators. In this way, you can add your own indicators to the indicators already provided in Trade Navigator, or you can add indicators from traders who have provided formulas for their indicators in books or magazines.
The TradeSense formula to create the trend trigger factor indicator requires you to create three functions that work together. We will call the indicators TTF, x days sell power, and x days buy power. TTF will require xdays sell power and xdays buy power in order to work.
To add the trend trigger factor indicator to the list of indicators in Trade Navigator, follow these steps:
x days sell power
1. Go to the Edit menu and click on Functions. This will bring
up the Trader's Toolbox already set to the Functions tab.
2. Click on the New button.
3. Type the formula Highest (High , xdays).xdays - Lowest (Low , xdays)
into the Function window. By setting xdays as an input, you can change
the default number later to customize the function.
4. Click on the Verify button. A message will pop up saying that xdays
is not recognized as an existing function or input. Click the Add button,
then doubleclick on the number in the Default Value field and change it
to 15. Take the checkmark out of Required and place a checkmark in Expression.
5. Click on the Save button. Type in x days sell power as the name
for the function and then click the OK button.
x days buy power
1. Go to the Edit menu and click on Functions. This will bring up the
Trader's Toolbox already set to the Functions tab.
2. Click on the New button.
3. Type the formula Highest (High , xdays) - Lowest (Low , xdays).xdays
into the Function window.
4. Click on the Verify button. A message will pop up saying that xdays
is not recognized as an existing function or input. Click the Add button,
then doubleclick on the number in the Default Value field and change it
to 15. Take the checkmark out of Required and place a checkmark in Expression.
5. Click on the Save button. Type in x days buy power as the
name for the function and then click the OK button.
TTF
1. Go to the Edit menu and click on Functions. This will bring up the
Trader's Toolbox already set to the Functions tab.
2. Click on the New button.
3. Type the formula ((x days Buy Power (15) - x days Sell Power (15))
/ (.5 * (x days Buy Power (15) + x days Sell Power (15)))) * 100 into the
Function window.
4. Click on the Save button. Type in a name for the function and then
click the OK button.
You can add your new TTF indicator to the chart (Figure 14) by clicking on the chart, typing "A," selecting the "Indicators" tab, selecting "TTF" (if this is what you chose to name the indicator) from the list, and clicking the "Add" button. You may then move the indicator to the desired pane by clicking and dragging the indicator's label into that pane.
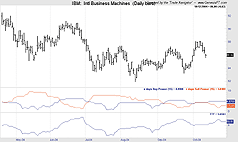
FIGURE 14: TRADE NAVIGATOR, TREND TRIGGER FACTOR. Here is a sample Trade Navigator chart displaying the trend trigger factor.
The x days sell power and x days buy power indicators can be added
to the chart in the same manner.
For your convenience, Genesis has created a special file that you can download through Trade Navigator that will add the TTF, xdays sell power, and xdays buy power indicators to Trade Navigator for you. Simply download the file "SandC001" using your Trade Navigator and follow the upgrade prompts.
--Michael Herman
Genesis Financial Technologies
https://www.GenesisFT.com
SMARTRADER: TREND TRIGGER FACTOR
The TTF indicator presented by M.H. Pee in "Trend Trigger Factor" is easily reconstructed in SmarTrader using the Highest and Lowest functions and a few user formulas.
The SmarTrader specsheet for the trend trigger factor (TTF) is shown
in Figure 15. First, we get the Highest value of the most recent 15 days'
highs. Then we add a user row, LOW15_30, to shift the low price prior to
using the Lowest function to get the lowest low in day 16 to day 30. Then
we calculate BuyPower in a user formula.
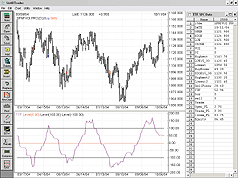
FIGURE 15: SMARTRADER, TREND TRIGGER FACTOR SPECSHEET. Here's the specsheet showing the formulas for implementing M.H. Pee's trend trigger factor.
Next, we add a user row, HIGH15_30, to shift the high price prior to using the highest function, Highest2, to extract the highest high in day 16 to day 30. Lowest2 uses the Lowest function to get the lowest low in the most recent 15 days. Then we calculate SellPower in a user formula.
Finally, we add a user formula to calculate TTF, using the formula as expressed in Pee's article.
We added system rules as user rows. A long entry is represented by buy being true when TTF is greater than 100. A short entry is represented by sell being true when TTF is less than -100. It should be noted that the trade values in the chart are points, not dollars (Figure 16).
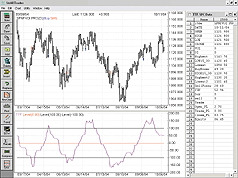
FIGURE 16: SMARTRADER, TTF CHART. Here's a sample SMARTrader chart displaying the trend trigger factor. Under Pee's system rules, enter long when TTF is greater than 100; enter short when TTF is less than -100. Note the trade values in the chart are points, not dollars.
--Jim Ritter
Stratagem Software
800 779-7353 or 504 885-7353
Info@strategem.com, Strategem1@aol.com
www.strategem1.com
INVESTOR/RT: TREND TRIGGER FACTOR
The trend trigger factor (TTF) from M.H. Pee's article in this issue
can be replicated in Investor/RT with a custom indicator. The syntax of
the TTF custom indicator is as follows:
TTF
100 * (CI_BuyPow - CI_SellPow) / (0.5 * (CI_BuyPow + CI_SellPow))
Where CI_BuyPow and CI_SellPow are in turn custom indicators with the following syntax:
BuyPow
STAT_HI - STAT_LO.15
SellPow
STAT_HI.15 - STAT_LO
STAT_HI is the statistics indicator setup with "Maximum high for
preceding 15 bars." STAT_LO is another instance of the statistics indicator,
this time set up with "Minimum low for the preceding 15 bars."
The TTF custom indicator can be seen in the lower pane of the chart in Figure 17, drawn as a green and red histogram. Signal markers are placed in the upper pane of the chart to denote when the TTF crossed important levels. Red upward arrows are drawn when TTF drops below -100, while green upward arrows are drawn where TTF crosses above 100.
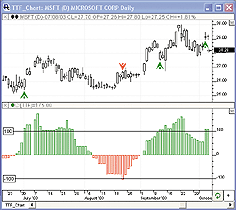
FIGURE 17: INVESTOR/RT, TREND TRIGGER FACTOR. This Investor/RT daily candlestick chart of MSFT shows the TTF indicator in the lower pane, drawn as a red and green histogram. Reference lines are drawn at the important levels of 100 and -100. The signal markers in the upper pane denote where TTF crossed below -100 (red) and crossed above 100 (green).
Related Links:
https://www.linnsoft.com/tour/techind/stat.htm
https://www.linnsoft.com/tour/customIndicator.htm
--Chad Payne, Linn Software
www.linnsoft.com, info@linnsoft.com
STOCKWIZ: TREND TRIGGER FACTOR
The following formula for StockWiz 4.0 issues market position signals based on the trend trigger factor (TTF) indicator described in this issue by M.H. Pee.
Long position signals are issued when the 15-day TTF value is greater than 100, and short position signals are generated when the 15-day TTF falls below -100. When the TTF is equal to or less than 100 and equal to or greater than -100, the formula issues a neutral signal (n).
The results are displayed in the worksheet, where the user can browse
the results and compare them with signals from other technical analysis
indicators.
(CLEAR)
(GRIDFIELD "Name" "STRING" "20")
(GRIDFIELD "LastClose" "STRING" "10")
(GRIDFIELD "Buy_Power" "STRING" "10")
(GRIDFIELD "Sell_Power" "STRING"º "10")
(GRIDFIELD "TTF_15" "STRING" "10")
(GRIDFIELD "MarketPosition" "STRING" "10")
# Load the first company in the worksheet
(SOURCE "WORKING_GROUP")
(SET I 0)
(SET STATUS (LOADFIRST))
(GOTO %ERROR (NE STATUS 0))
%NEXT:
# Get the price vectors needed for the TTF
(SET HIGHº (GETVECTOR (CURRENT) "HIGH"))
(SET LOWºº (GETVECTOR (CURRENT) "LOW"))
(GOTO %UPDATE (LT (VSIZE HIGH) 30))
(SET LASTCLOSE (GETDOUBLE "LastClose"))
# Compute the two 15-day ranges
(SET D1 (LASTDATE))
(SET D15 (DATEBSUB D1 15))
(SET D30 (DATEBSUB D15 15))
(SET HIGH1 (VEC2VEC HIGH D15 D1))
(SET HIGH2 (VEC2VEC HIGH D30 D15))
(SET LOW1 (VEC2VEC LOW D15 D1))
(SET LOW2 (VEC2VEC LOW D30 D15))
# The 15-day Buy Power
(SET BP (SUB (VMAX HIGH1) (VMIN LOW2)))
# The 15-day Sell Power
(SET SP (SUB (VMAX HIGH2) (VMIN LOW1)))
# The 15-day Trend Trigger Factor value
(SET TTF_15 (MUL (DIV (SUB BP SP) (MUL (ADD BP SP) 0.5)) 100))
(GRID (CURRENT) "LastClose" (DOUBL2STR LASTCLOSE "%.2lf"))
(GRID (CURRENT) "Buy_Power" (DOUBL2STR BP "%.2lf"))
(GRID (CURRENT) "Sell_Power" (DOUBL2STR SP "%.2lf"))
(GRID (CURRENT) "TTF_15" (DOUBL2STR TTF_15 "%.3lf"))
(GOTO %LONG (GT TTF_15 100))
(GOTO %SHORT (LT TTF_15 -100))
# Generate the market position based on the 15-day TTF value
%NEUTRAL: (SET SIGNAL "n")
(GRID (CURRENT) "Name" (GETSTRING "NAME"))
(GRID (CURRENT) "MarketPosition" SIGNAL)
(GOTO %UPDATE (TRUE))
%LONG: (SET SIGNAL "LONG")
(GRID (CURRENT) "Name" (GETSTRING "NAME"))
(GRID (CURRENT) "MarketPosition" SIGNAL)
(GOTO %UPDATE (TRUE))
%SHORT: (SET SIGNAL "SHORT")
(GRID (CURRENT) "Name" (GETSTRING "NAME"))
(GRID (CURRENT) "MarketPosition" SIGNAL)
(GOTO %UPDATE (TRUE))
%UPDATE: (SET I (ADD I 1))
(GOTO %EXIT (ESCAPE))
(SET STATUS (LOADNEXT))
(GOTO %NEXT (EQ STATUS 0))
%ERROR: (MESSAGE "An error has occurred - Unable to continue")
%EXIT: (EXIT 0)
--StockWiz
support@stockwiz.com
All rights reserved. © Copyright 2004, Technical Analysis, Inc.
Return to December 2004 Contents
