October 2004
TRADERS' TIPS
You can copy these formulas and programs for easy use in your spreadsheet or analysis software. Simply "select" the desired text by highlighting as you would in any word processing program, then use your standard key command for copy or choose "copy" from the browser menu. The copied text can then be "pasted" into any open spreadsheet or other software by selecting an insertion point and executing a paste command. By toggling back and forth between an application window and the open Web page, data can be transferred with ease.
This month's tips include formulas and programs for:
TRADESTATION: Fibonacci And Gann Projections
TRADESTATION: Fibonacci And Gann Projections
Dennis Peterson's article in this issue, "Fibonacci And Gann Projections," presents a technique for forecasting time and price turning points. The article discusses a "replay" style of chart reading. Thus, the TradeStation EasyLanguage code presented here discusses a procedure for "replaying" a chart in TradeStation.
The indicator provided here, "SqOf9_FibTimeComment," uses trendlines to mark forecasted price and time turning points, in accordance with the methodology described in Peterson's article. There needs to be ample chart space to the right of the chart's last bar for the code to work correctly. This extra space can be created by formatting the chart window and setting the "Space to the right" option. In this example, 30 bars were used for this setting. The number of bars required is established by the longest "zigzag" cycle, so every chart may require a different setting.
TradeStation's commentary feature can be used to "replay" the history of time/price forecasts made by the indicators. First, select a chart window so that it is the active window. Next, set the pointer tracking to "Window." Then activate the commentary feature by clicking the commentary icon (on the default "Chart Analysis" toolbar) then clicking somewhere in the chart window. A bar-by-bar replay can be performed by clicking on the bar for which the "replay" is desired to begin (with the analysis commentary pointer active) and then scrolling the chart, bar by bar, to the right using the right arrow key on the keyboard. The forecasts that would have been seen on that historical bar are displayed as the cursor is scrolled to the right using the right arrow key. (The commentary window that appears may be disregarded.) If the commentary feature is not activated, only the zigzags will be displayed on the chart; the forecasted turning points will not appear. A sample chart can be seen in Figure 1.
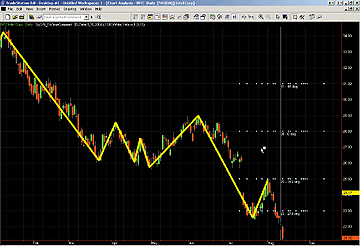
Figure 1: TRADESTATION, Fibonacci And Gann Projections. Here is a sample chart showing the SqOf9_FibTimeComment indicator on Intel. TradeStation's commentary feature can be used to "replay" the history of time/price forecasts made by the indicators.
An .ELD file including the EasyLanguage code will be posted in the
file library at TradeStationWorld.com. Look for the file "SqOf9_FibTimeCommentary.Eld."
Function:  TimeForecast
inputs:
 PresentDate( NumericSimple ) ,
 PresentTime( NumericSimple ) ,
 DaysAhead( NumericSimple ) ,
 HoursAhead( NumericSimple ) ,
 MinutesAhead( NumericSimple ) ,
 oFutureDate( NumericRef ) ,
 oFutureTime( NumericRef ) ;

variables:
 DateTime( 0 ) ,
 FutureDateTime( 0 ) ;
DateTime = DateToJulian( PresentDate ) +
 ( TimeToMinutes( PresentTime ) / 60 / 24 ) ;
FutureDateTime = DateTime + DaysAhead + ( HoursAhead /
 24 ) + ( MinutesAhead / 60 / 24 ) ;
if DayOfWeekFromDateTime( FutureDateTime ) = Saturday
 then
  FutureDateTime = FutureDateTime - 1
else if DayOfWeekFromDateTime( FutureDateTime ) = Sunday
 then
 FutureDateTime = FutureDateTime + 1 ;
oFutureDate = JulianToDate( IntPortion(
 FutureDateTime ) ) ;
oFutureTime = MinutesToTime( FracPortion(
 FutureDateTime ) * 60 * 24 ) ;
TimeForecast = FutureDateTime ;
Function: FibTimeForecasts
inputs:
 PivotValues[ MaxSize1, MaxSize2 ]( NumericArray ),
 { ZigZagPivots[Row1-6, 1] = price }
 { ZigZagPivots[Row1-6, 2] = date }
 FibDateTime[MaxSize3]( NumericArrayRef ) ;
variables:
 Counter( 0 ),
 FirstCall( true ) ;
arrays:
 FibNumbers[5]( 0 ),
 FibSwingRange[5]( 0 ) ;
if FirstCall then
 begin
 FibNumbers[1] = 0.382 ;
 FibNumbers[2] = 0.5 ;
 FibNumbers[3] = 0.618 ;
 FibNumbers[4] = 0.707 ;
 FibNumbers[5] = 1 ;
 FirstCall = false ;
 end ;
for Counter = 1 to 5
 begin
 FibSwingRange[Counter] = PivotValues[ Counter + 1,
  2 ] - PivotValues[ Counter, 2] ; { $f$9 through
  $f$13 }
 end ;
for Counter = 1 to 5
 begin
 FibDateTime[Counter] = FibNumbers[Counter] *
  FibSwingRange[5] + PivotValues[6, 2] ;
 end ;
for Counter = 6 to 10
 begin
 FibDateTime[Counter] = FibNumbers[ Counter - 5 ] *
  FibSwingRange[4] + PivotValues[6, 2] ;
 end ;
for Counter = 11 to 15
 begin
 FibDateTime[Counter] = FibNumbers[ Counter - 10 ] *
  FibSwingRange[2] + PivotValues[6, 2] ;
 end ;
for Counter = 16 to 20
 begin
 FibDateTime[Counter] = ( PivotValues[5, 2] -
  PivotValues[3, 2] ) * FibNumbers[ Counter - 15 ] +
    PivotValues[5, 2] ;
 end ;
for Counter = 21 to 25
 begin
 FibDateTime[Counter] = ( PivotValues[5, 2] -
  PivotValues[1, 2] ) * FibNumbers[ Counter - 20 ] +
  PivotValues[5, 2] ;
 end ;

FibTimeForecasts = 1 ;
Indicator: SqOf9_FibTimeComment
{
Square of Nine portions taken from:
https://www.tradestationworld.com/discussions/Topic.aspx?
TOPIC_ID=8289
Fibonacci time forecasts come directly from the TASC 1992 Robert
Miner article, "A Spreadsheet for Time Ratio Analysis."
The commentary features were written by Mitch Shack of TradeStation Securities, Inc.
Any misinterpretations of Fibonacci and Gann are my own.
--Mark Mills, TradeStation Securities, Inc.
}
inputs:
 YestDate( ELDate( 8, 10, 2004 ) ),
 TextPlaceTime( 1200 ),
 TextColor( White ),
 LineColor( Yellow ),
 LineStyle_1to5(1),
 ForecastWidth_0to6( 4 ),
 PriceForecastRange( 3 ),
 BaseNumber( 10 ),
 Price( Close ),
 RetracePct( 5 ),
 ZigZagLineWidth( 1 ),
  TextMinMoveOffset( -5 ) ;
variables:
 xloop( 0 ),
 Counter( 0 ),
 ColumnEnd( 0 ),
 HighRange( 0 ),
 LowRange( 0 ),
 Degree( "" ),
 ID( -1 ),
 DaysAhead( 0 ),
 HoursAhead( 0 ),
 MinutesAhead( 0 ),
 oFutureDate( 0 ),
 oFutureTime( 0 ),
 ValueSpace( 8 ),
 ValueSpace2( 11 ), { Print spacing }
 ValueSpace3( 4 ),
 ValueSpace4( 13 ),
 ValueSpace5( 14 ),
 YesClose( 0 ),
 ZeroDegrees( 1 ),
 FortyFiveDegrees( 2 ),
 NinetyDegrees( 3 ),
 OneThirtyFiveDegrees( 4 ),
 OneEightyDegrees( 5 ),
 TwoTwentyFiveDegrees( 6 ),
 TwoSeventyDegrees( 7 ),
 ThreeFifteenDegrees( 8 ),
 { Array Index Positions }
 DegreeSections( 8 ),
 FullArrayCount( 49 ),
 MyBaseNumber( 0 ),
 NewSwingPrice( 0 ),
 SwingPrice( Price ), { used as a convenient
  2-element array }
 SwingDate( Date ), { used as a convenient
  2-element array }
 SwingTime( Time ), { used as a convenient
  2-element array }
 TLDir( 0 ), { TLDir = -1 implies prev TL dn, +1
  implies prev TL up }
 RetraceFctrUp( 1 + RetracePct * 0.01 ),
 RetraceFctrDn( 1 - RetracePct * 0.01 ),
 SaveSwing( false ),
 AddTL( false ),
 UpdateTL( false ),
 TLRef( 0 ) ;
arrays:
 ZigZagPivots[6, 2]( 0 ), { ZigZagPivots[Row1-6, 1] =
  price, ZigZagPivots[Row1-6, 2] = date }
  FibTimeTargets[25]( 0 ),
 DegreeOfAngle[8, 49]( 0 ),
 DegreeOfAngleWord[8]( "" ) ;
if CurrentBar = 1 then
 begin
 MyBaseNumber = BaseNumber * 7 ;
 DegreeOfAngle[ ZeroDegrees, 0 ] = BaseNumber * 2 ;
 DegreeOfAngle[ FortyFiveDegrees, 0 ] =
  BaseNumber * 3 ;
 DegreeOfAngle[ NinetyDegrees, 0 ] = BaseNumber * 4 ;
 DegreeOfAngle[ OneThirtyFiveDegrees, 0 ] =
  BaseNumber * 5 ;
 DegreeOfAngle[ OneEightyDegrees, 0 ] =
  BaseNumber * 6 ;
 DegreeOfAngle[ TwoTwentyFiveDegrees, 0 ] =
  BaseNumber * 7 ;
 DegreeOfAngle[ TwoSeventyDegrees, 0 ] =
  BaseNumber * 8 ;
 DegreeOfAngle[ ThreeFifteenDegrees, 0 ] =
  BaseNumber * 9 ;
 Degree = " deg" ; { the degree symbol number }
 DegreeOfAngleWord[ ZeroDegrees ] = " - 0" + Degree ;
 DegreeOfAngleWord[ FortyFiveDegrees ] = " - 45" +
  Degree ;
 DegreeOfAngleWord[ NinetyDegrees ] = " - 90" +
  Degree ;
 DegreeOfAngleWord[ OneThirtyFiveDegrees ] = " - 135"
  + Degree ;
 DegreeOfAngleWord[ OneEightyDegrees ] = " - 180" +
  Degree ;
 DegreeOfAngleWord[ TwoTwentyFiveDegrees ] = " - 225"
  + Degree ;
 DegreeOfAngleWord[ TwoSeventyDegrees ] = " - 270" +
  Degree ;
 DegreeOfAngleWord[ ThreeFifteenDegrees ] = " - 315"
  + Degree ;
 for xLoop = 1 to FullArrayCount
  begin
  DegreeOfAngle[ ZeroDegrees, xLoop ] =
   DegreeOfAngle[ ZeroDegrees, xloop - 1 ]
   + DegreeOfAngle[ ZeroDegrees, 0 ]
   + MyBaseNumber + ( 8 * ( xLoop - 1 ) ) ;

   DegreeOfAngle[ FortyFiveDegrees, xLoop ] =
   DegreeOfAngle[ FortyFiveDegrees, xloop - 1 ]
   + DegreeOfAngle[ FortyFiveDegrees, 0 ]
   + MyBaseNumber + ( 8 * ( xLoop - 1 ) ) ;

  DegreeOfAngle[ NinetyDegrees, xLoop ] =
   DegreeOfAngle[ NinetyDegrees, xloop - 1 ]
   + DegreeOfAngle[ NinetyDegrees, 0 ]
   + MyBaseNumber + ( 8 * ( xLoop - 1 ) ) ;

  DegreeOfAngle[ OneThirtyFiveDegrees, xLoop ] =
   DegreeOfAngle[ OneThirtyFiveDegrees,
    xloop - 1 ]
   + DegreeOfAngle[ OneThirtyFiveDegrees, 0 ]
   + MyBaseNumber + ( 8 * ( xLoop - 1 ) ) ;

  DegreeOfAngle[ OneEightyDegrees, xLoop ] =
   DegreeOfAngle[ OneEightyDegrees, xloop - 1 ]
   + DegreeOfAngle[ OneEightyDegrees, 0 ]
   + MyBaseNumber + ( 8 * ( xLoop - 1 ) ) ;

  DegreeOfAngle[ TwoTwentyFiveDegrees, xLoop ] =
   DegreeOfAngle[ TwoTwentyFiveDegrees,
    xloop - 1 ]
   + DegreeOfAngle[ TwoTwentyFiveDegrees, 0 ]
   + MyBaseNumber + ( 8 * ( xLoop - 1 ) ) ;
  DegreeOfAngle[ TwoSeventyDegrees, xLoop ] =
   DegreeOfAngle[ TwoSeventyDegrees, xloop - 1 ]
   + DegreeOfAngle[ TwoSeventyDegrees, 0 ]
   + MyBaseNumber + ( 8 * ( xLoop - 1 ) ) ;
   DegreeOfAngle[ ThreeFifteenDegrees, xLoop ] =
   DegreeOfAngle[ ThreeFifteenDegrees, xloop - 1 ]
   + DegreeOfAngle[ ThreeFifteenDegrees, 0 ]
   + MyBaseNumber + ( 8 * ( xLoop - 1 ) ) ;
  end ;
 end ; { CurrentBar = 1 }
if Date <> Date[1] then
 YesClose = Close[1] ; { if new day get the SO9
  compare number }

{ ZigZag Calculations }
{ Candidate swings are just-confirmed, 3-bar (Str = 1),
SwingHi's and SwingLo's }
NewSwingPrice = SwingHigh( 1, Price, 1, 2 ) ;
if NewSwingPrice  <> -1 then
 begin
 if TLDir <= 0 and NewSwingPrice >= SwingPrice *
  RetraceFctrUp then { prepare to add new up TL }
  begin
  SaveSwing = true ;
  AddTL = true ;
  TLDir = 1 ;
  end
 else if TLDir = 1 and NewSwingPrice >= SwingPrice
  then { prepare to update prev up TL }
  begin
  SaveSwing = true ;
  UpdateTL = true ;
  end ;
 end
else
 begin
 NewSwingPrice = SwingLow( 1, Price, 1, 2 ) ;
 if NewSwingPrice <> -1 then
  begin
  if TLDir >= 0 and NewSwingPrice <= SwingPrice *
   RetraceFctrDn then
   { prepare to add new dn TL }
   begin
   SaveSwing = true ;
   AddTL = true ;
   TLDir = -1 ;
   end
  else if TLDir = -1 and NewSwingPrice <= SwingPrice
   then { prepare to update prev dn TL }
   begin
   SaveSwing = true ;
   UpdateTL = true ;
   end ;
  end ;
 end ;
if SaveSwing then
 { save new swing and reset SaveSwing }
 begin
 SwingPrice = NewSwingPrice ;
 SwingDate = Date[1] ;
 SwingTime = Time[1] ;
 SaveSwing = false ;
 end ;
if AddTL then { add new TL and reset AddTL }
 begin
 Plot1( Close ) ; { marks the point at which a leg of
  pivot is locked down }
 { push the pivot date and time into the array }
 { ZigZagPivots[Row1 - 6, 1] = price,
  ZigZagPivots[Row1 - 6, 2] = date, row 1 is the
  oldest }
 for Value1 = 1 to 5
  begin
  ZigZagPivots[ Value1, 2 ] = ZigZagPivots[ Value1 +
    1, 2 ] ;
  end ;
 ZigZagPivots[6,2] = DateToJulian( SwingDate ) +
  TimeToMinutes( SwingTime ) / ( 24 * 60 ) ;
 for Value1 = 1 to 5
  begin
  ZigZagPivots[ Value1, 1] = ZigZagPivots[ Value1 +
    1, 1 ] ;
  end ;
 ZigZagPivots[6,1] = SwingPrice ;
 Value1 = FibTimeForecasts( ZigZagPivots,
  FibTimeTargets ) ;
 { back to the original ZigZag code }
 TLRef = TL_New( SwingDate, SwingTime, SwingPrice,
  SwingDate[1], SwingTime[1], SwingPrice[1] ) ;
 TL_SetExtLeft( TLRef, false ) ;
 TL_SetExtRight( TLRef, false ) ;
 TL_SetSize( TLRef, ZigZagLineWidth ) ;
 TL_SetColor( TLRef, LineColor ) ;
 AddTL = false ;
 end
else if UpdateTL then
 { update prev TL and reset UpdateTL }
 begin
 TL_SetEnd( TLRef, SwingDate, SwingTime,
  SwingPrice ) ;
 UpdateTL = false ;
 end ;
if AtCommentaryBar then
 begin
 xLoop = 0 ;
 ColumnEnd = 0 ;
 while xLoop < FullArrayCount and ColumnEnd = 0
  begin
  xLoop = xLoop + 1 ;
  if DegreeOfAngle[ ZeroDegrees, xLoop ] > YesClose
   then
   ColumnEnd = xLoop ; { searching for SO9 numbers
    that are between YesClose }
  end ;
 LowRange = IntPortion( YesClose -
  PriceForecastRange ) ;
 HighRange = IntPortion( YesClose +
  PriceForecastRange ) ;
 for Counter = ColumnEnd - 1 to ColumnEnd
  begin
  for xLoop = 1 to DegreeSections
   begin
   if IFFLogic( DegreeOfAngle[ xLoop, Counter ] >=
    LowRange and DegreeOfAngle[ xLoop, Counter] <=
    HighRange, true, false ) then
    begin
    for Value99 = 1 to 25
     begin
     MinutesAhead = ( IntPortion(
      FibTimeTargets[Value99] - ( DateToJulian
      ( date ) + ( TimeToMinutes( Time ) / (
      60 * 24 ) ) ) ) ) * ( 60 * 24 ) ;
     Value1 = TimeForecast( Date, Time, 0, 0,
       MinutesAhead, oFutureDate,
      oFutureTime ) ;
     Value1 = TL_New( oFutureDate,
      oFutureTime, DegreeOfAngle[ xLoop,
      Counter ], oFutureDate, oFutureTime,
      DegreeOfAngle[ xLoop, Counter ] -
      MinMove / PriceScale ) ;
     TL_SetStyle(Value1,LineStyle_1to5);
     TL_SetSize( Value1, ForecastWidth_0to6 ) ;
     ID = Text_New( Date, TextPlaceTime,
      DegreeOfAngle[ xLoop, Counter ] +
      TextMinMoveOffset * MinMove /
      PriceScale, NumToStr( DegreeOfAngle[
      xLoop, Counter ], 0 ) +
      DegreeOfAngleWord[xLoop] ) ;
     Value1 = Text_SetColor( ID, TextColor ) ;
     end ; { FibTimeTargets loop }
    end ; { IFFLogic }
   end ; { xLoop }
  end ; { Counter }
 end ; { Date = }
--Mark Mills
MarkM@TSSec at www.TradeStationWorld.com
EasyLanguage Questions Forum
TradeStation Securities, Inc.
A subsidiary of TradeStation Group, Inc.
AMIBROKER: Fibonacci And Gann Projections
In "Fibonacci And Gann Projections," Dennis Peterson shows how to display time projections based on the zigzag indicator and Fibonacci ratios, as well as price projections based on Gann square of nine calculations. This kind of analysis can be relatively easily reproduced using AmiBroker's own programming language, AFL.
The code in Listing 1 plots the zigzag indicator overlaid on a price chart plus projected time/price points (blue/orange dots). Using AmiBroker, one does not need the bar replay feature used in the eSignal code referred to in the article [and printed in this Traders' Tips section --Ed.], because the same effect could be achieved by AFL coding alone. The code presented here uses AmiBroker's vertical selector line to allow the user to choose the ending point. All "future" bars (after the selection line) are plotted in a gray color, while "past" bars are plotted in black (Figure 2). Projections are plotted according to user date selection, with blue dots (time projections) and orange dots (square of nine price projections). As an alternative, the user may download a free program from AmiBroker's mailing list (https://finance.groups.yahoo.com/group/amibroker/files/Simulator124.zip) that provides the bar replay feature to all AmiBroker users.
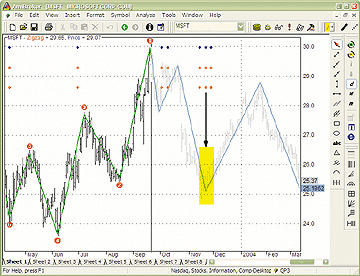
Figure 2: AMIBROKER, Fibonacci And Gann Projections. This screenshot shows a daily chart of Microsoft (MSFT) with an overlaid zigzag line as well as time and price projection points (blue/orange dots). Note that a significant market bottom has been successfully predicted by the three dots clustered between November 14 and 26.
LISTING 1
Change = 5;
GannIncrement = 0.0625;
procedure PlotShapeAt( x, y, shape, shift )
{
  PlotShapes( IIf( BarIndex() == x, shape, 0 ), colorRed, 0, y, shift );
}
procedure PlotBlueDot( x, y )
{
  PlotShapes( IIf( BarIndex() == x, shapeSmallCircle, 0 ),
              colorBlue, 0, y, 0  );

  for( i = -2; i <= 2; i++ )
  {
   if( i != 0 )
   {
      yGann = ( sqrt( y ) + i * GannIncrement ) ^ 2;
      PlotShapes( IIf( BarIndex() == x, shapeSmallCircle, 0 ),
                  colorOrange, 0, yGann, 0  );
   }
  }
}
bi = BarIndex();
sbi = SelectedValue( bi );
GraphXSpace = 2;
Plot( Zig( C, Change ), "Zigzag", colorGreen, styleThick );
Plot( C, "Price", IIf( bi > sbi, colorLightGrey, colorBlack ), styleBar );
upshift = 15;
if( SelectedValue( PeakBars( C, Change ) < TroughBars( C, Change ) ) )
{
   pt1 = PeakBars( C, Change, 1 ) == 0 ;
   pt2 = TroughBars( C, Change, 1 ) == 0 ;
}
else
{
   pt1 = TroughBars( C, Change, 1 ) == 0 ;
   pt2 = PeakBars( C, Change, 1 ) == 0 ;
   upshift = -upshift;
}
bpt1 = SelectedValue( ValueWhen( pt1, bi ) );
bpt2 = SelectedValue( ValueWhen( pt2, bi ) );
bpt3 = SelectedValue( ValueWhen( pt1, bi, 2 ) );
bpt4 = SelectedValue( ValueWhen( pt2, bi, 2 ) );
bpt5 = SelectedValue( ValueWhen( pt1, bi, 3 ) );
bpt6 = SelectedValue( ValueWhen( pt2, bi, 3 ) );
PlotShapeAt( bpt1, C, shapeDigit1, upshift );
PlotShapeAt( bpt2, C, shapeDigit2, -upshift  );
PlotShapeAt( bpt3, C, shapeDigit3, upshift );
PlotShapeAt( bpt4, C, shapeDigit4, -upshift );
PlotShapeAt( bpt5, C, shapeDigit5, upshift );
PlotShapeAt( bpt6, C, shapeDigit6, -upshift );
Level = SelectedValue( ValueWhen( pt1, C ) );
PlotBlueDot( round( bpt1 + 1.618 * ( bpt1 - bpt2 ) ), Level );
PlotBlueDot( round( bpt1 + 0.382 * ( bpt1 - bpt2 ) ), Level );
PlotBlueDot( round( bpt1 + 0.5 * ( bpt2 - bpt3 ) ), Level );
PlotBlueDot( round( bpt1 + 1.732 * ( bpt2 - bpt3 ) ), Level );
PlotBlueDot( round( bpt1 + 0.618 * ( bpt4 - bpt5 ) ), Level );
PlotBlueDot( round( bpt1 + 2 * ( bpt4 - bpt5 ) ), Level );
PlotBlueDot( round( bpt2 + 0.6707 * ( bpt4 - bpt2 ) ), Level );
PlotBlueDot( round( bpt2 + 2.618 * ( bpt4 - bpt2 ) ), Level );
PlotBlueDot( round( bpt2 + 1 * ( bpt6 - bpt2 ) ), Level );
PlotBlueDot( round( bpt2 + 3 * ( bpt6 - bpt2 ) ), Level );
--Tomasz Janeczko, AmiBroker.com
www.amibroker.com
WEALTH-LAB: Fibonacci And Gann Projections
When we were provided with an advance copy of Dennis Peterson's article for this issue, "Fibonacci And Gann Projections," with its 500+ lines of eSignal code and comments, we knew this Traders' Tip was going to present a good programming challenge (it did). Making use of our trusty ZigZagX study from the November 2003 Traders' Tips, we squeezed the implementation into 150 sparsely commented lines of WealthScript code. The study's swing line colors were changed, however, to be compatible with our chart's color scheme (Figure 3).
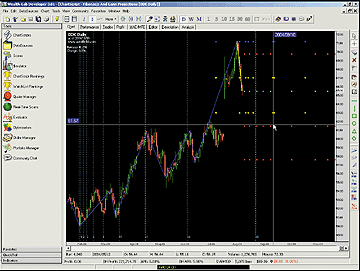
Figure 3: WEALTH-LAB. Fibonacci And Gann Projections. With the DrawImage function in Wealth-Lab, you can plot any bitmap image in any location on the chart, as we did here. The blue and yellow dots are the projections from the last confirmed swing, whereas the green and red diamonds are relative to unconfirmed swings in formation. We added the Fibonacci Time Zones using the drawing toolbar (far right).
The script automatically adds space to the right of the final bar,
and off-the-chart Fibonacci projections show up on a light red background
on the far right. Finally, programmers may be interested in the use of
the variant array and especially in the recursive routine used to fill
another array containing the bar numbers of swing points.
WealthScript code:
{$I 'ZigZagX Study'}
const revPct = 5.0; // Reversal percentage
const MaxFutureBars = 100;
const GannIncr = 0.25;
const GannPjs = 2; // 4 gann projs above, below
const Np = 9;      // 10 fib projections
const SwPts = 8;   // 7 swings, 1 unconf'd, 1 extra
{ array of swing bar numbers }
var swgBar: array[0..SwPts] of integer;
{ fib projections in time, contains Bar Numbers }
var fp: array[0..Np] of integer;
{ swing distances (bars) corresponding to fp }
var sd: array[0..Np] of integer;
{ gann price projections, Confirmed & Unconfirmed }
var gp: array[-1 * GannPjs..GannPjs] of float;
var Bar, Series: integer;
var fib: COMVariantArray;
var Rtr, Chg: float;
       { DR1, DR2, A11, A12, A21, A22, C1, C2, D1, D2 }
fib := [0.382,1.618,0.5,1.732,0.618,2,0.707,2.618,1,3];
Series := #Close;
procedure MakeSpace( Number: integer );
begin
  AddFutureBars( Number );
  for Bar := BarCount - 1 downto 0 do
    if SyntheticBar( Bar ) then
      SetBarColor( Bar, #Black )
    else break;
end;
procedure DrawProjections( Conf: integer );
begin
  var i, j: integer;
  var Img1: string = 'RedDiamond';
  var Img2: string = 'GreenDiamond';
  if Conf = 1 then
  begin
    Img1 := 'YellowDot';
    Img2 := 'BlueDot';
  end;
  for i := 0 to SwPts do
    for j := -GannPjs to GannPjs do
      if j > 0 then
        DrawImage( Img1, 0, fp[i], gp[j], false )
      else if j < 0 then
        DrawImage( Img1, 0, fp[i], gp[j], true )
      else
        DrawImage( Img2, 0, fp[i], gp[j], true );
end;
{ Pass Conf = 1 for confirmed swing }
procedure ProjectFibs( Conf: integer );
begin
{ swg is the period between swings}
  var swgPer: array[0..Np] of integer;
  var j: integer;
  swgPer[0] := swgBar[Conf] - swgBar[Conf+1];
  swgPer[1] := swgPer[0];
  swgPer[2] := swgBar[Conf+1] - swgBar[Conf+2];
  swgPer[3] := swgPer[2];
  swgPer[4] := swgBar[Conf+3] - swgBar[Conf+4];
  swgPer[5] := swgPer[4];
  swgPer[6] := swgBar[Conf+1] - swgBar[Conf+3];
  swgPer[7] := swgPer[6];
  swgPer[8] := swgBar[Conf+1] - swgBar[Conf+5];
  swgPer[9] := swgPer[8];
  if Conf = 1 then
    for j := 0 to Np do
      if j < 6 then
        fp[j] := swgBar[1] + Round( swgPer[j] * fib[j] )
      else
        fp[j] := swgBar[2] + Round( swgPer[j] * fib[j] );
  if Conf = 0 then
    for j := 0 to Np do
      if j < 6 then
        fp[j] := swgBar[0] + Round( swgPer[j] * fib[j] )
      else
        fp[j] := swgBar[1] + Round( swgPer[j] * fib[j] );
  DrawProjections( Conf );
end;
{ Fills array with Gann projections }
procedure SqrOf9( Conf: integer );
begin
  var g: integer;
  var Prc: float = GetSeriesValue( swgBar[Conf], Series );
  for g := -GannPjs to GannPjs do
    if g = 0 then
      gp[0] := Prc
    else
      gp[g] := Sqr( Sqrt( Prc ) + g * GannIncr );
  ProjectFibs( Conf );
end;
{ Uses recursion to fill array w/ swing bar numbers }
procedure FillSwingBars( Idx, pb, tb: integer );
begin
  var pBar, tBar: integer;
  var uSwg, f: float;
  pBar := PeakBar( pb, Series, revPct );
  tBar := TroughBar( tb, Series, revPct );
  if pBar > tBar then  // peak is last
  begin
    if Idx = 0 then
    begin
      swgBar[0] := LowestBar( pb, Series, pb - pBar );
      f := GetSeriesValue( swgBar[0], Series );
      uSwg := PriceClose( pBar ) - f;
      Rtr := uSwg/(PriceClose( pBar ) - PriceClose( tBar ));
      Chg := ( PriceClose( pb ) - f ) / uSwg;
      Inc( Idx );
    end;
    swgBar[Idx] := pBar;
    Inc( Idx );
    swgBar[Idx] := tBar;
  end else             // trough is last
  begin
    if Idx = 0 then
    begin
      swgBar[0] := HighestBar( tb, Series, tb - tBar );
      f := GetSeriesValue( swgBar[0], Series );
      uSwg := f - PriceClose( tBar );
      Rtr := uSwg/(PriceClose( pBar ) - PriceClose( tBar ));
      Chg := ( f - PriceClose( tb ) ) / uSwg;
      Inc( Idx );
    end;
    swgBar[Idx] := tBar;
    Inc( Idx );
    swgBar[Idx] := pBar;
  end;
  Inc( Idx );
  if Idx < SwPts then
    FillSwingBars( Idx, pBar - 1, tBar - 1 );
end;
HideVolume;
SetColorScheme( #Lime,922,#Olive,#Black,#Silver,#Silver );
ZigZagX( #Close, 0, revPct, false );
FillSwingBars( 0, BarCount - 1, BarCount - 1);
SqrOf9( 1 );  SqrOf9( 0 );
MakeSpace( 75 );
SetBackgroundColor( BarCount - 1, #RedBkg );
SetBarColor( BarCount - 1, #RedBkg );
DrawLabel('Retrace: '+ FormatFloat( '0.0%', 100*Rtr ), 0 );
DrawLabel('Change: '+ FormatFloat( '0.0%', 100*Chg ), 0 );
--Robert Sucher
www.wealth-lab.com
eSIGNAL: Fibonacci And Gann Projections
Here is the eSignal code for the Fibonacci and Gann projections technique
given in Dennis Peterson's article in this issue, "Fibonacci And Gann Projections."
/*****************************************************************
Provided By : eSignal. (c) Copyright 2004
Study:        Swing Prediction
Version:      1.0
Formula Parameters:                 Default:
    * Swing: # of Bars              1
This is the minimum number of bars required to define a swing point.
This number is for both sides of the swing point (i.e. 5 bars on
 the left and right of the swing bar).
    * Swing: Wave Type              % Change in Price
        (% Retracement, % Change in Price)
    * Swing: Wave Percentage        5
The number 5 will be treated as 5.0%.
The number 0.05 will be treated as 0.0005%.
    * Swing High Price Source       Close
    * Swing Low Price Source        Close
    * Line Thickness                2
    * Confirmed Swing Line Color    Blue
    * Developing Swing Line Color   Yellow
    * Number of Swings for Gann     1
The number of previous swings points to be included in the Gann projections
    * Gann Increment                0.25
The +/- increment for Gann calculation above and below the base calculation for Gann.
    * Number of Gann Increments     2
        The number of Gann increments to be calculated above and below
        the Gann basis calculation. 2 will draw one above and one below the basis.
    * Fibonacci: DR 1               0.382
    * Fibonacci: DR 2               1.618
    * Fibonacci: A1 1               0.5
    * Fibonacci: A1 2               1.732
    * Fibonacci: A2 1               0.618
    * Fibonacci: A2 2               2.0
    * Fibonacci: C 1                0.707
    * Fibonacci: C 2                2.618
    * Fibonacci: DC 1               1.0
    * Fibonacci: DC 2               3.0
*****************************************************************/
function preMain() {
    setPriceStudy(true);
    setStudyTitle("Swing Prediction ");
    setShowCursorLabel(false);
    setShowTitleParameters(false);

    var fp1 = new FunctionParameter("nNum", FunctionParameter.NUMBER);
    fp1.setName("Swing: # of Bars");
    fp1.setLowerLimit(1);
    fp1.setDefault(1);

    var fp2a = new FunctionParameter("sWaveType", FunctionParameter.STRING);
    fp2a.setName("Swing: Wave Type");
    fp2a.addOption("% Retracement");
    fp2a.addOption("% Change in Price");
    fp2a.setDefault("% Change in Price");

    var fp2 = new FunctionParameter("nRet", FunctionParameter.NUMBER);
    fp2.setName("Swing: Wave Percentage");
    fp2.setLowerLimit(0);
    fp2.setDefault(5);
    var fp3 = new FunctionParameter("sHighSource", FunctionParameter.STRING);
    fp3.setName("Swing High Price Source");
    fp3.addOption("Open");
    fp3.addOption("High");
    fp3.addOption("Low");
    fp3.addOption("Close");
    fp3.setDefault("Close");
    var fp4 = new FunctionParameter("sLowSource", FunctionParameter.STRING);
    fp4.setName("Swing Low Price Source");
    fp4.addOption("Open");
    fp4.addOption("High");
    fp4.addOption("Low");
    fp4.addOption("Close");
    fp4.setDefault("Close");
    var fp5 = new FunctionParameter("nThickness", FunctionParameter.NUMBER);
    fp5.setName("Line Thickness");
    fp5.setLowerLimit(1);
    fp5.setDefault(2);
    var fp6 = new FunctionParameter("cColor1", FunctionParameter.COLOR);
    fp6.setName("Confirmed Swing Line Color");
    fp6.setDefault(Color.blue);
    var fp7 = new FunctionParameter("cColor2", FunctionParameter.COLOR);
    fp7.setName("Developing Swing Line Color");
    fp7.setDefault(Color.yellow);

    var fp19 = new FunctionParameter("nGann", FunctionParameter.NUMBER);
    fp19.setName("Number of Swings for Gann");
    fp19.setLowerLimit(1);
    fp19.setUpperLimit(6);
    fp19.setDefault(1);

    var fp19b = new FunctionParameter("nGannInc", FunctionParameter.NUMBER);
    fp19b.setName("Gann Increment");
    fp19b.setLowerLimit(0);
    fp19b.setDefault(0.25);
    var fp19c = new FunctionParameter("nGannNum", FunctionParameter.NUMBER);
    fp19c.setName("Number of Gann Increments");
    fp19c.setLowerLimit(0);
    fp19c.setDefault(2);
    var fp20 = new FunctionParameter("fib0", FunctionParameter.NUMBER);
    fp20.setName("Fibonacci: DR 1");
    fp20.setLowerLimit(0);
    fp20.setDefault(0.382);
    var fp21 = new FunctionParameter("fib1", FunctionParameter.NUMBER);
    fp21.setName("Fibonacci: DR 2");
    fp21.setLowerLimit(0);
    fp21.setDefault(1.618);
    var fp22 = new FunctionParameter("fib2", FunctionParameter.NUMBER);
    fp22.setName("Fibonacci: A1 1");
    fp22.setLowerLimit(0);
    fp22.setDefault(0.5);
    var fp23 = new FunctionParameter("fib3", FunctionParameter.NUMBER);
    fp23.setName("Fibonacci: A1 2");
    fp23.setLowerLimit(0);
    fp23.setDefault(1.732);
    var fp24 = new FunctionParameter("fib4", FunctionParameter.NUMBER);
    fp24.setName("Fibonacci: A2 1");
    fp24.setLowerLimit(0);
    fp24.setDefault(0.618);
    var fp25 = new FunctionParameter("fib5", FunctionParameter.NUMBER);
    fp25.setName("Fibonacci: A2 2");
    fp25.setLowerLimit(0);
    fp25.setDefault(2);
    var fp26 = new FunctionParameter("fib6", FunctionParameter.NUMBER);
    fp26.setName("Fibonacci: C 1");
    fp26.setLowerLimit(0);
    fp26.setDefault(0.707);
    var fp27 = new FunctionParameter("fib7", FunctionParameter.NUMBER);
    fp27.setName("Fibonacci: C 2");
    fp27.setLowerLimit(0);
    fp27.setDefault(2.618);
    var fp28 = new FunctionParameter("fib8", FunctionParameter.NUMBER);
    fp28.setName("Fibonacci: DC 1");
    fp28.setLowerLimit(0);
    fp28.setDefault(1.0);
    var fp29 = new FunctionParameter("fib9", FunctionParameter.NUMBER);
    fp29.setName("Fibonacci: DC 2");
    fp29.setLowerLimit(0);
    fp29.setDefault(3.0);
}
var bEdit = true;       // tracks change of user inputs
var cntr = 0;           // image counter for swing lines
var bInit = false;      // initialization routine completion
var nNumBars = null;    // number of bars for defining swings
var sWaveTypeG = null;  // wave type for confirming swings
var nRetpcnt = null;    // percent retracement for defining swings
var nThicknessG = null; // line thickness
var cColorCon = null;   // confirmed swing color
var cColorDev = null;   // developing swing color
var nGannG = 1;         // number of swings for Gann calculations
var nGannIncG = null;   // increment value for Gann calculations
var nGannNumG = null;   // number of increments for Gann calculations
var sHSource = null;    // price source for high swings
var sLSource = null;    // price source for low swings
var x1a = null;         // x-coordinate for point a of developing line 1
var x1b = null;         // x-coordinate for point b of developing line 1
var x2a = null;         // x-coordinate for point a of developing line 2
var x2b = null;         // x-coordinate for point b of developing line 2
var y1a = null;         // y-coordinate for point a of developing line 1
var y1b = null;         // y-coordinate for point b of developing line 1
var y2a = null;         // y-coordinate for point a of developing line 2
var y2b = null;         // y-coordinate for point b of developing line 2
var aY2A = new Array(7);// array of current 7 swing prices
var vLastSwing = null;  // tracking swing type of last confirmed swing
var nScntr = 0;         // bar counter for swing confirmation
var aSwingsIndex = new Array(7); // tracks current swings for DR, C, DC, A1, A2 periods
var aSwingsPrice = new Array(7); // tracks current swing prices for Gann projections
var aFibs = new Array(10);       // Fibonacci numbers for Swing Predictions
var bProjCon = false;
var bProjDev = false;
var tCntr = 0;
function main(nNum, sWaveType, nRet, sHighSource, sLowSource, nThickness, cColor1, cColor2,
              nGann, nGannInc, nGannNum, fib0, fib1, fib2, fib3, fib4, fib5, fib6, fib7, fib8, fib9) {
    var nState = getBarState();
    var nIndex = getCurrentBarIndex();
    var h = getValue(sHighSource);
    var l = getValue(sLowSource);
    var c = close();
    var i = 0;
    // record keeping
    if (nState == BARSTATE_NEWBAR) {
        if (cntr > 100) cntr = 0;
        if (x1a != null) x1a -= 1;
        if (x1b != null) x1b -= 1;
        if (x2a != null) x2a -= 1;
        if (x2b != null) x2b -= 1;
        i = 0;
        for (i = 0; i < 7; ++i) {
            if (aSwingsIndex[i] != null) aSwingsIndex[i] -= 1;
        }
    }
    //Initialization
    if (bEdit == true) {
        if (nNumBars == null) nNumBars = nNum;
        if (sWaveTypeG == null) sWaveTypeG = sWaveType;
        if (nRetpcnt == null) nRetpcnt = nRet/100;
        if (nThicknessG == null) nThicknessG = nThickness;
        if (cColorCon == null) cColorCon = cColor1;
        if (cColorDev == null) cColorDev = cColor2;
        if (nGann != null) nGannG = nGann;
        if (nGannIncG == null) nGannIncG = nGannInc;
        if (nGannNumG == null) nGannNumG = Math.round(nGannNum);
        if (sHSource == null) sHSource = sHighSource;
        if (sLSource == null) sLSource = sLowSource;
        if (x1a == null) x1a = 0;
        if (y1a == null) y1a = c;
        i = 0;
        for (i = 0; i < 10; ++i) {
            aFibs[i] = eval("fib"+i);
        }
        bEdit = false;
    }
    if (bInit == false) {
        bInit = Init(h,l,c);
    }
    // Swings
    if (nState == BARSTATE_NEWBAR) {
        nScntr += 1;
        // confirmed Swings
        if (nScntr > nNumBars) {
            confirmSwings();
            if (bInit == true) {
                doLine("dev1");
                doLine("dev2");
            }
        }
    }
    checkSwings(h, l);
    if (bProjCon == true) {
        bProjCon = false;
        doProjections("con");
    }
    if (bProjDev == true) {
        bProjDev = false;
        doProjections("dev1");
    }
    if (nIndex >= -1) {
        var nWaveRet = (Math.abs(aSwingsPrice[0]-aSwingsPrice[1]) / Math.abs(aSwingsPrice[1]-aSwingsPrice[2]))*100;
        var sWaveRetText = " \%Rtmt: " + nWaveRet.toFixed(2) + " ";
        var nWaveChg = (Math.abs(y2a-y2b) / y1b)*100;
        var sWaveChgText = " \%Chg: " +  nWaveChg.toFixed(2) + " ";
        drawTextRelative(2, 25, sWaveRetText, Color.navy, Color.lightgrey,
            Text.BOLD|Text.LEFT|Text.VCENTER|Text.FRAME|Text.RELATIVETOBOTTOM,
            null, 12, "Ret");
        drawTextRelative(2, 5, sWaveChgText, Color.navy, Color.lightgrey,
            Text.BOLD|Text.LEFT|Text.VCENTER|Text.FRAME|Text.RELATIVETOBOTTOM,
            null, 12, "Chg");
    }
    return;
}
/***********************/
/******  Functions *****/
/***********************/
function Init(h,l,c) {
    if (close(-(nNumBars*2)) == null) {
        return false;
    } else {
        // Find initial line.
        // The initial line will be the first high or low swing,
        // which has the greater difference of the swing point to
        // the close of the first bar.
        var Index = getCurrentBarIndex()
        var hIndex = Index;
        var lIndex = Index;
        var j = nNumBars*2;
        var aHigh = getValue(sHSource, 0, -j);
        var aLow = getValue(sLSource, 0, -j);
        var vHH = aHigh[0];
        var vLL = aLow[0];
        var tempIndex = Index;
        var i = 0;
        for (i = 0; i < j; ++i) {
            if (aHigh[i] > vHH) {
                vHH = aHigh[i];
                hIndex = tempIndex;
            }
            if (aLow[i] < vLL) {
                vLL = aLow[i];
                lIndex = tempIndex;
            }
            tempIndex -= 1;
        }
        if (vHH - y1a > y1a - vLL) {
            vLastSwing = "L";
            x1b = hIndex - Index;
            y1b = vHH;
            doLine("dev1");
            x2a = x1b;
            y2a = vHH;
            x2b = 0;
            y2b = c;
            doLine("dev2");
        } else {
            vLastSwing = "H";
            x1b = lIndex - Index;
            y1b = vLL;
            doLine("dev1");
            x2a = x1b;
            y2a = vLL;
            x2b = 0;
            y2b = c;
            doLine("dev2");
        }
    }

    if (vLastSwing != null) {
        return true;
    } else {
        return false;
    }
}
function doLine(sType) {
    //confirmed
    if (sType == "con") {
        cntr += 1;
        drawLineRelative(x1a, y1a, x1b, y1b, PS_SOLID,
            nThicknessG, cColorCon, sType+cntr);
        x1a = x2a;
        y1a = y2a;
        x1b = x2b;
        y1b = y2b;
        x2a = x1b;
        y2a = y1b;
        aSwingsIndex.pop();
        aSwingsIndex.unshift(x1b);
        aSwingsPrice.pop();
        aSwingsPrice.unshift(y1b);
        if (vLastSwing == "H") y2b = getValue(sHSource);
        if (vLastSwing == "L") y2b = getValue(sLSource);
        aY2A.pop();
        aY2A.unshift(y2a);
        if (aSwingsIndex[6] != null) {
            bProjCon = true;
        }
    }
    // dev1
    if (sType == "dev1") {
        drawLineRelative(x1a, y1a, x1b, y1b, PS_SOLID,
            nThicknessG, cColorDev, sType);
        aSwingsIndex[0] = x1b;
        aSwingsPrice[0] = y1b;
        if (aSwingsIndex[6] != null && getCurrentBarIndex() >= -1) {
            bProjDev = true;
        }
    }

    // dev2

    if (sType == "dev2") {
        if (x2a != 0 && x2a != x2b) {
            if ( (vLastSwing == "H" && sHSource == "Close") || (vLastSwing == "L" && sLSource == "Close") ) {
                x2b = 0;
                y2b = close();
            }
            drawLineRelative(x2a, y2a, x2b, y2b, PS_SOLID,
                nThicknessG, cColorDev, sType);
        } else {
            removeLine(sType);
        }
    }
    return;
}
function confirmSwings() {
    if (x1b != x2b) {   // underdeveloped dev1 line
        if (sWaveTypeG == "% Retracement") {
            var nWave = (Math.abs(y2a-y2b) / Math.abs(y1b-y1a));
        } else {
            var nWave = (Math.abs(y2a-y2b) / y1b);
        }
        if (vLastSwing == "L" && nWave >= nRetpcnt ) {
            // Swing High
            nScntr = 0;
            vLastSwing = "H";
            doLine("con");
        } else if (vLastSwing == "H" && nWave >= nRetpcnt ) {
            // Swing Low
            nScntr = 0;
            vLastSwing = "L";
            doLine("con");
        }
    }

    return;
}
function checkSwings(h, l) {
    // dev1
    if (vLastSwing == "L") {         // find Swing High
        if (h >= y1b) {  // higher high, no swing
            nScntr = 0;
            x1b = 0;
            y1b = h;
            doLine("dev1");
            x2a = 0;
            y2a = h;
        }
    } else if (vLastSwing == "H") {  // find Swing Low
        if (l <= y1b) {  // Lower low, no swing
            nScntr = 0;
            x1b = 0;
            y1b = l;
            doLine("dev1");
            x2a = 0;
            y2a = l;
        }
    }
    // dev2
    if (nScntr == 0) {
        x2b = 0;
        if (vLastSwing == "H") y2b = h;
        if (vLastSwing == "L") y2b = l;
    } else {
        if (vLastSwing == "H" && h >= y2b) {
            y2b = h; x2b = 0;
        } else if (vLastSwing == "L" && l <= y2b) {
            y2b = l; x2b = 0;
        }
    }
    doLine("dev2");
    return;
}
function doProjections(sName) {
    var i = 0;
    var j = 0;
    var k = 0;
    var nGannTot = (nGannNumG*2) + 1; // total number of Gann rows
    var aX = new Array(10);
    var aY = new Array(10);
    var aSwingPeriods = new Array(10);
    var nOffset = 0;  // 0 for developing swings, 1 for confirmed swings

    if (sName == "con") nOffset = 1;
    var DR = aSwingsIndex[0+nOffset] - aSwingsIndex[1+nOffset];
    aSwingPeriods[0] = DR;
    aSwingPeriods[1] = DR;
    var C  = aSwingsIndex[1+nOffset] - aSwingsIndex[3+nOffset];
    aSwingPeriods[2] = C;
    aSwingPeriods[3] = C;
    var DC = aSwingsIndex[1+nOffset] - aSwingsIndex[5+nOffset];
    aSwingPeriods[4] = DC;
    aSwingPeriods[5] = DC;
    var A1 = aSwingsIndex[1+nOffset] - aSwingsIndex[2+nOffset];
    aSwingPeriods[6] = A1;
    aSwingPeriods[7] = A1;
    var A2 = aSwingsIndex[3+nOffset] - aSwingsIndex[4+nOffset];
    aSwingPeriods[8] = A2;
    aSwingPeriods[9] = A2;

    if (sName == "con") {
        i = 0;
        for (i = 0; i < nGannG; ++i) {
            for (k = 0; k < 10; ++k) {
                for (j = 0; j < nGannTot; ++j) {
                    removeShape("dev1Proj"+i+k+j);
                }
            }
        }
    }

    // X - Projections
    // anchor is from end of DR wave for DR, A1 and A2
    // anchor is from beginning of DR wave for C and DC
    i = 0;
    for (i = 0; i < 10; ++i) {
        if (i >= 2 && i <= 5) { // C and DC
            aX[i] = Math.round((aSwingPeriods[i] * aFibs[i]) + aSwingsIndex[1+nOffset]);
        } else { // DR, A1 and A2
            aX[i] = Math.round((aSwingPeriods[i] * aFibs[i]) + aSwingsIndex[0+nOffset]);
        }
    }

    // Y - Projections
    var aY = new Array(nGannG); // number of swings
    i = 0;
    for (i = 0; i < nGannG; ++i) {
        aY[i] = new Array(nGannTot);    // number of rows per swing
    }
    i = 0;
    for (i = 0; i < nGannG; ++i) {
        var nBasis = Math.sqrt(aSwingsPrice[i+nOffset]);
        var nNum = (nGannIncG * nGannNumG);
        for (j = 0; j < nGannTot; ++j) {
            aY[i][j] = (nBasis + nNum) * (nBasis + nNum);
            nNum -= nGannIncG;
        }
    }

    // plot Swing Predictions
    i = 0;
    for (i = 0; i < nGannG; ++i) {  // number of swings
        for (k = 0; k < 10; ++k) {  // 10 swing periods (5 waves * 2 fibs for each)
            for (j = 0; j < nGannTot; ++j) {  // total rows per swing
                var ShapeFlags = null;
                if (sName == "con") {
                    var ProjColor = cColorDev;
                    var vShape = "Shape.CIRCLE";
                } else {
                    var ProjColor = Color.red;
                    var vShape = "Shape.DIAMOND";
                }
                if (j == ((nGannTot/2)-.5) ) {
                    if (sName == "con") {
                        ProjColor = cColorCon;
                        vShape = "Shape.CIRCLE";
                    } else {
                        ProjColor = Color.green;
                        vShape = "Shape.DIAMOND";
                    }
                    ShapeFlags = "Shape.ONTOP";
                }
                drawShapeRelative(aX[k], aY[i][j], eval(vShape), null, ProjColor,
                    eval(ShapeFlags), sName + "Proj"+i+k+j);
            }
        }
    }

    return;
}
--Jason Keck
eSignal, a division of Interactive Data Corp.
800 815-8256, www.esignalcentral.com
NEUROSHELL TRADER: Fibonacci And Gann Projections
In "Fibonacci And Gann Projections," Dennis Peterson presents eSignal code [printed in this Traders' Tips section--Ed.] designed to help predict turning points, or peaks and valleys. However, NeuroShell Trader Professional has an inexpensive add-on already available to do just that. We will use the peak and valley probability indicators from our Turning Points add-on.
After installing the Turning Points add-on, you can insert the peak and valley probability indicators by doing the following:
1. Select "New Indicator ..." from the Insert menu.
2. Select the Turning Points category.
3. Select the PeakProb, ValleyProb, and TPplot indicators.
4. Select the Neighborhood and Window Size as you desire.
The peak probability and valley probability indicators use the mean
and standard deviation of the percent change in value from peak to valley
or from valley to peak. Once these two characteristics of the percent change
are known in the lookback window, it is possible to compute the probability
that the most recent bar is at a new peak or at a new valley. The Turning
Points add-on algorithm does not just blindly search for the first consecutive
valley after a peak (or a first consecutive peak after a valley); it tries
to optimize on turning points and locates such peaks and valleys as a human
expert would choose by looking at the chart.
In addition to probabilities based on percent change, the Turning Points add-on includes indicators to provide probabilities for peaks and valleys based on horizontal change (bars), as well as many other statistical measures.
The TPplot indicator may be used as a visual aid for peak and valley locations on the chart. It connects consecutive TPs with straight lines (Figure 4).
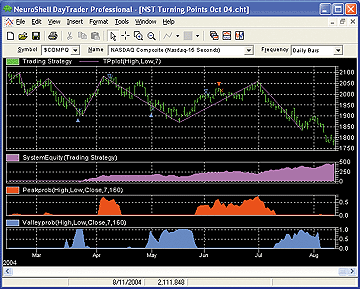
Figure 4: NEUROSHELL TRADER, Fibonacci And Gann Projections. This NeuroShell Trader chart displays bar charts of the probabilities of peaks and valleys created with the Turning Points add-on. The data displayed is from the paper-trading (out-of-sample) period.
You can automatically backtest the usefulness of the peak and valley
probability indicators by inserting them into a Trading Strategy as follows:
1. Select "New Trading Strategy" from the Insert menu.The genetic algorithm optimizer in NeuroShell Trader can find the most profitable settings, including B above as well as the neighborhood and window size. This can provide you with your own custom version of the peak and valley probability indicators that works best with your market sector.
2. On the Long Entry tab, select the "Add Conditions" button, Relational category, A > B.
3. Set A = Valley Prob and B = 0.5.
4. On the Long Exit tab, select the "Add Conditions" button, Relational category, A > B.
5. Set A = Peak Prob, and B = 0.5.
6. On the Short Entry tab, select the "Add Conditions" button, Relational category, A > B.
7. Set A = Peak Prob, and B = 0.5.
8. On the Short Exit tab, select the "Add Conditions" button, Relational category, A > B.
9. Set A = Valley Prob and B = 0.5.
Using NeuroShell Trader's ability to backtest and paper trade on out-of-sample data, you can get complete statistical reports on the successfulness of peak and valley trading strategies.
The example given above is but a very simple use of two of the many indicators in the Turning Points add-on. For example, you can add Fibonacci retracement levels using the Fibonacci retracement indicator. Far more complicated strategies can be built, and the indicators make great inputs to our neural networks, enabling nonlinear predictions of turning points.
Users of NeuroShell Trader who already own the Turning Points add-on can go to the STOCKS & COMMODITIES section of the NeuroShell Trader free technical support website to download a copy of the chart we built to predict future turning points.
--Marge Sherald, Ward Systems Group, Inc.
301 662-7950, sales@wardsystems.com
www.neuroshell.com
NEOTICKER: Fibonacci And Gann Projections
To implement in NeoTicker the idea presented in "Fibonacci And Gann Projections" by Dennis Peterson, we'll use a script indicator. This indicator is named swprediction with 21 parameters. Those parameters are the same as the ones shown in the eSignal code in this section, which is referred to in the article.
To reproduce the QQQ chart (Figure 5) shown in the article using NeoTicker, first add a daily QQQ data series. Then select the data series and add swprediction with default parameters. The result will resemble the chart shown in Peterson's article.
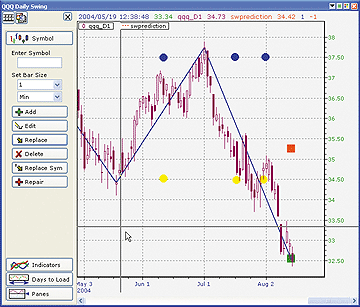
Figure 5: NEOTICKER, FIBONACCI AND GANN PROJECTIONS, QQQ DAILY SWING. To reproduce the QQQ chart shown in Peterson's article, first add a daily QQQ data series. Then select the data series and add swprediction with default parameters.
Swprediction can also be added to other indexes to show projection
of support and resistance levels. The SPX chart (Figure 6) has demonstrated
this fact.
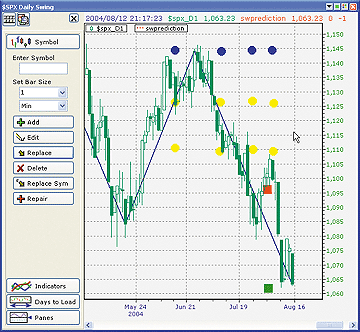
Figure 6: NEOTICKER, FIBONACCI AND GANN PROJECTIONS, SPX DAILY SWING. Swprediction can also be added to other indexes to show projection of support and resistance levels. The SPX chart demonstrates this fact.
Because the code is too long to list here, for readers who are interested
in seeing this indicator in action, the indicator source code is available
for download at the NeoTicker Yahoo! User Group site.
--Kenneth Yuen, TickQuest Inc.
www.tickquest.com
PROPHET.NET: Fibonacci And Gann Projections
Fibonacci and Gann projections, described by Dennis Peterson in his article in this issue, are available on the Prophet.Net website to all premium members. No coding is required on the part of the user. The indicator is built into the JavaCharts applet.
We have created two indicators in JavaCharts based on Peterson's article:
Fibonacci-Gann Projections Change %, and Fibonacci-Gann Projections Retrace
%, which are useful for detecting swings. For one-click access to these
indicators, go to JavaCharts from your computer's browser:
https://www.prophet.net/analyze/javacharts.jsp
or click the "Analyze" tab on the Prophet.net website, then click
the JavaCharts selection:
Click on the Tools menu (which you can also access by right-clicking anywhere on a chart) and choose "Apply Studies" from the Studies menu item. The list of available studies (approximately 150 of them, shown in alphabetical order) is in the second dropdown menu; you can choose Fibonacci-Gann Projections Change % or Fibonacci-Gann Projections Retrace % from this list. You may also adjust the parameters for this study if you desire.
When using either Fibonacci-Gann Projections Change % or Fibonacci-Gann Retrace %, there are three numerical parameters you can change. The first, wave %, denotes the retracement percentage. The next value, Gann inc value, denotes the size of the Gann increment. The third, Gann increments, specifies the required number of bars to the right or left of the pivot peak or valley. All of these are provided with default values, so you don't need to change anything unless you want to do so.
In the example shown in Figure 7, Intel's price swings in late 2003 are tracked by the Fibonacci-Gann Projections Change % (whose parameters and last values are shown in the upper-left portion of the chart). The signal of a potential turning point is seen as the two brown squares clustered around February 23.
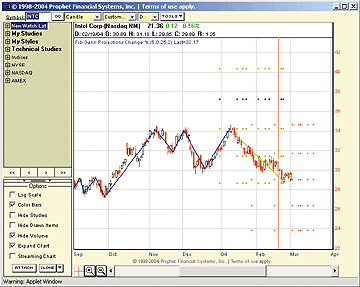
Figure 7: PROPHET, Fibonacci And Gann Projections. Intel's price swings in late 2003 are tracked by the Fibonacci-Gann Projections Change % (whose parameters and last values are shown in the upper-left portion of the chart). The signal of a potential turning point is seen as the two brown squares clustered around February 23.
Full access to the JavaCharts study set is available only with a
premium membership to Prophet, which starts at $14.95 per month. Real-time
market data is available for equities, options, and futures. A one-week
trial providing immediate access to all features and studies is available
from https://www.prophet.net/tasc.
--Prophet.net
SMARTRADER: CRACK SPREAD
The term crack spread refers to the "catalytic cracking" process used at refineries to separate crude oil into marketable products such as unleaded gasoline, heating oil, and various lesser components. The "3-2-1" crack is based on three barrels of crude oil, which will produce two barrels of unleaded gas and one barrel of heating oil. This technique is used as a theoretical refinery to determine the profitability of trading the contracts used in the spread calculation.
In this spread, we will be using three crude contracts (CL), two unleaded gas contracts (HU), and one heating oil contract (HO). Since crude is priced by the barrel, and the other contracts are priced by the gallon, it is necessary to adjust them to a 42-gallon barrel equivalent.
The SmarTrader specsheet is shown in Figure 8. First, in row 25, crude, we multiply the price of crude by three contracts. Row 26, UL_gas, multiplies the price of unleaded by two contracts, then by 42 to equate the result to a per-barrel price. In row 27, H_oil, we multiply the price of one heating oil contract by 42 to equate to a per-barrel price.
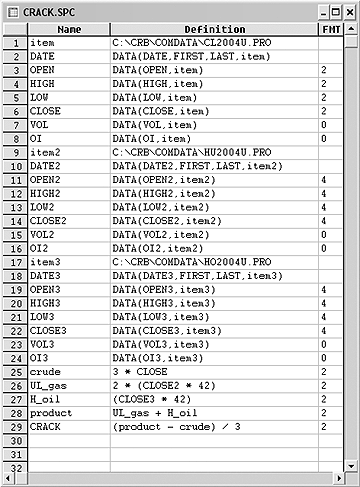
Figure 8: SMARTRADER, CRACK SPREAD. Here is the spreadsheet containing the calculations for determining the profitability of trading the contracts used in the spread calculation.
Now that all contracts are on the same price basis, row 28, product,
sums the value of the refined unleaded and heating oil products. Finally,
row 29, Crack, calculates the difference of the product value less the
cost of the crude and divides the result by 3, reducing the spread to a
per-barrel value.
Since profitability depends on the spread paying production costs before yielding a profit, a narrow spread will tend to push product prices up. A wide spread yields a high profit over production costs, causing a push in production and a supply-driven reduction in prices.
Referring to the sample crack chart shown in Figure 9, you can see that the spread value has been all over the map in recent months. As of this writing, the spread is $6.48. It will be interesting to see where prices are by the time this Traders' Tip is published.
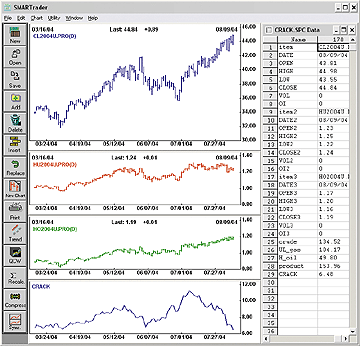
Figure 9: SMARTRADER, CRACK SPREAD. Since profitability depends on the spread paying production costs before yielding a profit, a narrow spread will tend to push product prices up. A wide spread yields a high profit over production costs, causing a push in production and a supply-driven reduction in prices. At the time this screen capture was taken, the crack spread is $6.48. Where is it today?
Visit SmarTrader's website for more information or to download a
copy of the specsheet.
--Jim Ritter, Stratagem Software
800 779-7353 or 504 885-7353,
info@stratagem1.com, Stratagem1@aol.com
www.stratagem1.com
All rights reserved. © Copyright 2004, Technical Analysis, Inc.
Return to October 2004 Contents