SUPPORT AND RESISTANCE
Among the first things anyone who studies technical analysis learns is the role that support and resistance play in market price action. Why does a collapse in the price of cattle futures abruptly end and suspend in place, as if tethered by an invisible string? Why does a breakout in a stock occasionally stop dead in its tracks as if it hit a brick wall and refuse to move higher? Often, the answers to these questions are support and resistance, respectively.
And while there are some technical analysts (to say nothing of most fundamental analysts) who think both support and resistance are overrated characteristics of price action ("How many times," they ask support and resistance believers, "has a stock plunged through an alleged support level as if it were not even there? How many times has a stock smashed through an alleged resistance level as if that level had the consistency of wet tissue?"), enough traders and investors see prices skid to a halt when encountering a trendline, moving average, Fibonacci retracement level, pivot point, or some other market phenomenon to keep the concepts of support and resistance at the forefront of any technical discussion of price movement in the marketplace.
TRUE MEANING
So what exactly do support and resistance mean in the context of a technical analysis of the markets? Here’s John Murphy’s explanation of the concept of technical support, from his book The Visual Investor:
Support refers to a reaction low, or trough, that was formed sometime in the past. Analysts often speak of prices bouncing off a support level. They’re usually referring to nothing more than a prior low formed sometime in the last week, month, or year. Remember that support is always below the market. What the market does at that support is very important. If the market closes below the support level (referred to as breaking support), the downtrend is resumed. The ability of prices to bounce off that support level (referred to as a successful test of support) is usually the first sign that the downtrend is ending and that prices are beginning to bottom.
Put most simply, though, support refers to any level that prices in a downtrend are unable to penetrate. While Murphy refers specifically to reaction lows and trough lows, it is also possible for this level to be designated by a moving average or a trendline. Support is often created directly by past price action, but as in the case of a moving average, it might actually be the average of a price series (such as the average close over the past 50 days) that determines the point at which falling prices may, at least temporarily, stop falling.
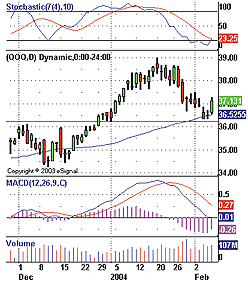
Consider the chart of the QQQ shown in Figure 1. Note how the QQQ was in a downtrend that began in the middle of January 2004. This downtrend took the QQQ from a price of $39 to about $36.25 when it stopped and, at least initially, reversed course. What stopped the QQQ?

Figure 1: RESISTANCE IN DECEMBER BECOMES SUPPORT IN FEBRUARY.
TRUE RESISTANCE
But how can we discuss the opposite of support, resistance, without explanation? Here is Alexander Elder’s understanding of what technical resistance means in the marketplace:
"Resistance is a price level where selling is strong enough to interrupt or reverse an uptrend. When an uptrend hits resistance, it stops or tumbles down like a man who hits his head on a branch while climbing a tree. Resistance is represented on a chart by a horizontal or near-horizontal line connecting several tops.
"Resistance is an area where bulls feel pain, bears feel regret, and both are ready to sell. When prices break down from a trading range, bulls who bought feel pain, feel trapped, and wait for a rally to let them get out even. Bears regret that they have not shorted more and wait for a rally to give them a second chance to sell short. Bulls’ pain and bears’ regret create resistance - a ceiling above the market …"
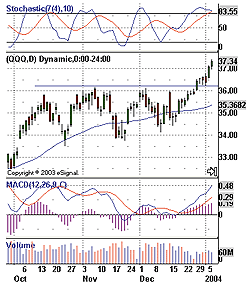
Let’s take another look at that chart of the QQQ (Figure 2), focusing this time on the October/November time frame. The three price peaks in mid-October, early November, and early December all seem unable to rise above the $36 level. While some of these rallies come closer than others (October was especially feeble, while November was relatively robust), none of them close above $36. It is not until late December when buyers of the QQQ are sufficiently strong enough to overwhelm those who apparently were ready to sell or short the QQQ every time it reached $36.

Figure 2: FOUR TIMES IS THE CHARM AS THE QQQ BATTLES OVERHEAD RESISTANCE FROM MID-OCTOBER TO LATE DECEMBER.
Support and resistance skeptics do have a point. Often a trader will see resistance looming in the horizon and sell, only to have the stock smash through resistance and continue upward. Even worse, a trader might be fretting over a losing position and, seeing a support level close by, decide to hold on and "let the stock bounce." Then, to the trader’s horror, the stock instead plunges through the so-called support level like a Hawaiian cliff diver into the blue waters below.
TRUE SUPPORT
Is there any way to determine when a potential support level will turn out to provide true support? Is there any way to know whether a resistance ceiling will be strong enough to halt a market’s advance? As you might expect, there is no indicator that can gauge the strength of a support or resistance level. However, there are a few rules of thumb that can help a trader manage the risk as a support or resistance level comes closer:
1. Generally speaking, the longer a support or resistance area has been in place, the stronger that support or resistance is likely to be.2. As a support or resistance level draws near, tighter stops (real or mental) are one way to limit the damage in case the stock, currency, or futures contract does the unexpected. Think of looming support or resistance in the stock market the way a fundamental analyst might think of earnings season. Be more concerned about the reaction to the level than the level itself.
3. Often, a stock will find support or resistance at a level that seems incomprehensible. To get some idea, look at that stock in a longer time frame. For example, if you have an inexplicable pause in a decline in a stock while using a 15-minute chart, switch to the hourly or daily chart to see if there is support in a longer time frame that wasn’t obvious at the 15-minute level. Many times, support and resistance that shows up in longer time frames is more powerful than support and resistance that appears in shorter time frames. Switching between time frames can help traders spot market phenomena like support and resistance that might not be visible at a level geared toward the shorter durations.
-David Penn, Technical Writer
Learn more about support & resistance!
Edwards, Robert D., and John Magee [1966]. Technical Analysis Of
Stock Trends, John Magee Inc.
Elder, Alexander [1993]. Trading For A Living, John Wiley &
Sons.
Evans, Richard L. [1991]. "Guidelines With Support And Resistance,"
Technical Analysis of STOCKS & COMMODITIES, Volume 9: September.
Evens, Stuart [1999]. "Support And Resistance," Technical Analysis
of STOCKS & COMMODITIES, Volume 17: January.
Forman, John H. [1995]. "Candlesticks For Support And Resistance,"
Technical Analysis of STOCKS & COMMODITIES, Volume 13: June.
Gandevani, Ned [1999]. "Identifying Crucial Support And Resistance
Levels," Technical Analysis of STOCKS & COMMODITIES, Volume
17: July.
Hartle, Thom [2002]. "Cueing Off Support And Resistance Levels," Technical
Analysis of STOCKS & COMMODITIES, Volume 20: September.
Kosar, John J. [1991]. "Support And Resistance," Technical Analysis
of STOCKS & COMMODITIES, Volume 9: January.
Merrill, Arthur A. [1990]. "Resistance," Technical Analysis of
STOCKS & COMMODITIES, Volume 8: March.
Murphy, John J. [1996]. The Visual Investor, John Wiley &
Sons.
Narcouzi, Christopher [2000]. "The Strength Of Support And Resistance,"
Technical Analysis of STOCKS & COMMODITIES, Volume 18:
July.
Peterson, Dennis D. [2001]. "Resistance And Support," Working Money,
November.
Star, Barbara [1995]. "Support And Resistance With The Andrews Pitchfork,"
Technical Analysis of STOCKS & COMMODITIES, Volume 13: November.
Thompson, Jesse H. [1983]. "The Nature Of Price Resistance," Technical
Analysis of STOCKS & COMMODITIES, Volume 1: May.
Originally published in the June 2004 issue of Technical Analysis of STOCKS & COMMODITIES magazine. All rights reserved. © Copyright 2004, Technical Analysis, Inc.
Return to June 2004 Contents