Turn It Up!
Does Volume Matter?
by Thomas N. Bulkowski
If a chart pattern breaks out on high volume, is it a blessing or a curse?
Recently, I was reading some reviews on Amazon.com for a book on technical analysis, and one reader comment that stuck in my mind was that the author didn't discuss volume. Maybe it's because volume isn't important, I thought. In my daily routine, I rarely look at volume unless I'm considering a trade. Otherwise, it doesn't even appear on my screen. But how important is volume? Does a high-volume breakout really suggest a better-performing pattern? Does a receding volume trend over the lifetime of the pattern suggest better post-breakout performance? I decided to find answers to these questions.
Measuring breakout volume
How do you measure volume? An exceptionally high daily volume in a sparsely traded stock might be less than an hour's worth in an actively traded stock. So stock-to-stock comparisons would be worthless. To measure volume, I chose the volume average for each stock.
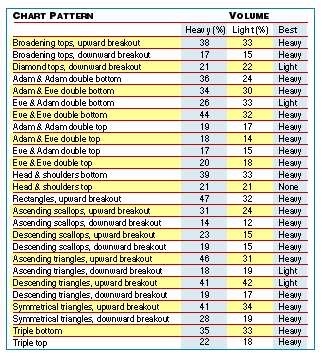
I computed the average volume for the three months before the breakout and assigned two categories to the breakout volume: above-average volume (more than twice the average) or low volume (average or below average). Then I looked at chart patterns and mapped the volume with performance. Figure 1 shows the results.

Figure 1: VOLUME AND PERFORMANCE. Heavy breakout volume usually propels a stock higher.
...Continued in the June issue of Technical Analysis of
STOCKS & COMMODITIES
Excerpted from an article originally published in the June 2004 issue of Technical Analysis of STOCKS & COMMODITIES magazine. All rights reserved. © Copyright 2004, Technical Analysis, Inc.
Return to June 2004 Contents