Making The Most Of Mutual Funds
Zigzag And One Rank Compared
by Norman J. Brown
Try this to switch mutual funds.
The zigzag indicator has long been used to pick out the peaks and troughs of the price changes (rate of change, or Roc) of stocks and mutual funds. However, such an indicator typically cannot be used as an investing tool for switching funds. This is because the process of confirming the peaks or troughs with a following trough or peak will introduce excessive delays.
OVERCOMING THESE DELAYS
These delays can be overcome if you set the zigzag filter level below the smallest ROC of the fund being investigated. For example, assume all ROCs are greater than +/-0.01% and that the zigzag filter is set to 0.01%. Then any peak formed by one or more up days is immediately confirmed by any subsequent down day, as that down value always exceeds the filter level.
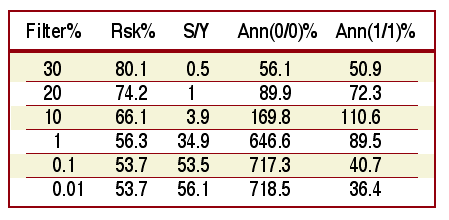
To confirm this approach, I applied zigzag with various filter levels to the Fidelity mutual fund FSPTX over a period of 10 years, 1993-2003. The data in Figure 1 shows that as the filter value becomes smaller, the parameters converge at a filter threshold of 0.01%, just as anticipated. Since the peaks/troughs are determined as they occur, the delay (Q command in FastTrack) is 0/0. If the delay is increased by one day (so you can take action with a buy or sell), the annualized return drops from 718.5% to 36.4%.

Figure 1: APPLYING ZIGZAG. Here you see the results of applying zigzag at various filter levels to Fidelity mutual fund FSPTX (1993-2003).
...Continued in the June issue of Technical Analysis of
STOCKS & COMMODITIES
Excerpted from an article originally published in the June 2004 issue of Technical Analysis of STOCKS & COMMODITIES magazine. All rights reserved. © Copyright 2004, Technical Analysis, Inc.
Return to June 2004 Contents