888OPTIONS.COM
This site could have been named "AllAboutOptions.com" or "Everything-You-Wanted-To-Know-About-Options-But-Were-Afraid-To-Ask.com," but it would have been more difficult to find a phone number that matched.
The Options Industry Council (OIC) developed 888Options.com to educate the investing public (and their brokers) about the benefits and risks of exchange-traded options. While options are highly flexible, versatile, and often rewarding, they are also complex, tricky, and risky. In their continuing endeavor to educate investors in the skills of trading options, the OIC conducts hundreds of seminars throughout the year, distributes thousands of videos and brochures, and maintains the 888Options.com website focused on options education.
The OIC's seminars provide insight into the challenges experienced by individual investors when they enter the arena of options trading. As the instructors are all experienced in the world of options, they are able to give valuable views into both the good and the not-so-good sides of options trading.

In addition, industry experts were employed in making the training videos, the informational brochures, and the 888Options.com website. As is necessary in this day and age, the OIC lawyers have given all of the OIC presentation materials a thorough going-over to make sure that dangers, as well as the advantages, of options trading are well represented.
On, and off, the road again...
OIC seminars on options-related topics are presented in roadshows across the United States and in other parts of the world like Australia, Hong Kong, and Singapore. For those who like to do their learning at home, they provide interactive educational software: The Options Investigator. This software package has 400 tutorials and over 40 options strategies that allow for simulated options trading. It is available as a CD-Rom or online. The OIC newsletter is Options Central, and it is published online four times a year.
The OIC is a nonprofit association. Although it was formed in 1992 by the Options Clearing Corporation (OCC) and the option exchanges of the US, since 1998 it has been headquartered in London. After reading this overview and looking at the site, you can ask questions or make comments and suggestions by emailing the organization at options@theocc.com.
The American Stock Exchange, the Chicago Board Options Exchange, the International Securities Exchange, the Pacific Exchange, the Philadelphia Stock Exchange, and the Options Clearing Corp. are all sponsors of the OIC. Their common goal is to provide a financially sound and efficient marketplace. Trader education is one path toward accomplishing that goal, so the OIC has become a natural conduit for such information. As more individuals realize that options can enhance their portfolios, the education available through Oic will become ever more important.
You can speak to a real person at the Options Investor Services department by calling 888 Options (678-4667) or by emailing options@theocc.com. Questions, requests, and seminar registrations for courses can be addressed from 7:30 am-5:00 pm Central Time on weekdays. Those answering the phones cannot and will not make suggestions as to what specific options should be bought or sold, but they can help with other types of questions related to the options industry.

All that said, the first thing you should do is explore the site. It provides a ton of information, including a glossary that defines everything from arbitrage to market-on-close orders to vertical spreads. The site has options exercises, strategies, information on options assignments, getting in and out of trades, Leaps, splits, mergers, technical information of many varieties, and much, much more. There is a page that defines the symbols used in options jargon known as the greeks. Oh, and did I mention expiration calendars and 20-minute delayed quotes?
Bottom line, if you are looking for answers to questions about options, or think you might actually want to join the options trading fray, 888Options.com would be one of the first places on the Internet that you would be well advised to visit.
--Bruce Faber, Staff Writer
STOCKCONSULTANT.COM
How much information do you really want to know about the stocks you are thinking about trading and investing? This was the first reaction I had when I typed Yahoo's stock symbol (Yhoo) in the "enter symbol" box of StockConsultant.com. With the click of a mouse, StockConsultant.com produced a stock report for Yhoo that was as comprehensive as any I've come across on the Internet.
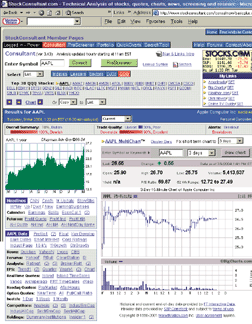
Doubt it? Consider what you get: a multichart geared toward intraday (15-minute) data, with daily last, change, open, high, low and volume information, current price/earnings ratio, and 52-week price range. To the left of the multichart, there is a year-view area chart; an array of links for headlines from media sources like CNN; an earnings calendar; premarket quotes and indicators; and additional stock-specific data such as short interest, float, corporate ratings, 10k filings, yearly and quarterly growth, and an industry overview page.
Below all this (Figure 1) are more news links (Quicken, Yahoo! News, Lycos, and CBS), stock forums (Yahoo! Financial, Raging Bull, ClearStation, and so on), analyst ratings, earnings per share and EPS trends, real-time quotes from electronic communications networks and exchanges like Island and Archipelago, options quotes (including put/call ratios), a look at competing companies in the same sector or industry, and information on both institutional sponsorship as well as insider buys and sells.
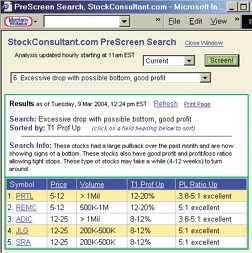
Figure 2: Prescreener. The PreScreener starts traders and investors out with a few preset screening criteria for breakouts, breakdowns, and momentum plays.
Not bad -- for a start. Scroll on down.
The rest of the Consultant Report consists of a variety of detailed subsections -- price and volume, overall summary, position indicators, timing indicators, detailed chart, resistance and support areas, upside trade, and downside trade -- and here is where the real consulting begins. For example, in the Price & Volume subsection, StockConsultant.com notes the current price relative to the previous day's close, as well as the typical price range from the previous day's close in both points and percentages (for example, +/-0.83 points and +/-1.9%). Daily volume is also noted, with the average daily volume over the past month provided. Here, too, daily volume figures are put in context with typical volume.
The consultant's consultant
Subsequent sections provide even more exacting (or "opinionated") analysis. The Overall Summary generalizes the verdict from all of StockConsultant.com's bullish and bearish indicators to produce ratings: Hold, mild to very strong Outperform, or mild to very strong Underperform. In addition, the Overall Summary includes probability and confirmation indicators that let traders and investors know whether a given stock is more likely to form a bottom, continue a strong uptrend/rally from a pullback, form a top, or continue a strong downtrend or fade after an "extreme" rally.
This summary also includes a "neutral" indicator for nontrending stocks (stocks that have been flat for a month or more, stocks in consolidation, and so on). The reports in this section read like: "intermediate trend possibly bullish, sideways trend at lower support" (a bullish probability report), or "mild bearish one-day moneyflow at this price level" (a bearish confirmation report). A detailed help menu is provided, which will prove invaluable to those learning how to operate the software.
Entry- and exit-specific information is available in the Position Indicators section. Here, StockConsultant notes one-day price change, short-term direction, a comparison of "typical" and "extreme" rallies and pullbacks, degree of overbought or oversold, one-month trend, a bullish/bearish read on the intermediate trend, and a report on resistance and/or support (including notes on the type and strength of the resistance or support provided).
Timing indicators -- also helpful in determining entries and exits -- focus on a chart alert (based on bullish/bearish chart patterns), moneyflow, and the existence of a breakout or breakdown. A "Detailed Chart" includes six months of price data and can be configured into bar or candlestick format. Up and down volume are noted below the total volume, and traders and investors can add moving averages from two to 120 periods. Another option adds a variety of resistance and support levels, long and short targets, as well as breakout/breakdown targets right on the price chart for easy reference.
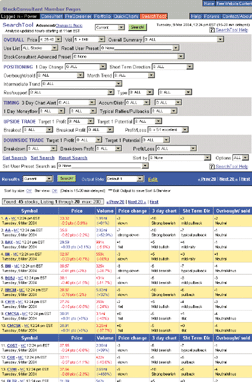
Figure 3: Search. StockConsultant.com's search tool allows for a more exacting stock screen than what is offered in the PreScreener.
Finally, the Detailed Chart has four additional "special" features: NewsChart, which provides stock news of the day when the trader clicks on a chart bar/candlestick; SmartVolume, which eliminates volume spikes; RallyBands, which mark areas where typical and extreme pullbacks and bounces have historically occurred; and DualVolume, which divides volume into up and down characteristics.
The "Resistance & Support Areas" section is, in part, an expansion of the information on resistance and support provided in "Position Indicators." Support and resistance come in both types and degrees of strength. "Type" refers specifically to the number of times a given support or resistance level has been tested (for example, type double means that a support or resistance level has been tested twice). "Strength" ranges on a scale from one to 10 and refers to the amount of accumulation or distribution that is taking place at the support or resistance level.
The "Upside Trade" and "Downside Trade" sections, respectively, examine the probability of gains to the upside or downside as a percentage, and then go on to provide potential target upsides and downsides, stop-loss levels, downside risk, and profit/loss ratio. For example, StockConsultant.com regards Yhoo ("Last: 43.57") as having an upside trade quality of 65% ("Fair"). The near target price is 49.13 for a profit of 12.8%. This, StockConsultant.com tells us, is based on the typical rally in Yhoo based on recent price action (the "Position Indicator" mentioned helps point to this).
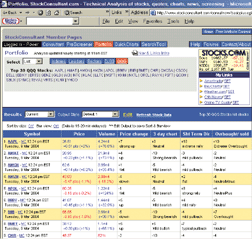
Figure 4: Portfolio. The StockConsultant.com portfolio servers as a traditional portfolio, but it can also be used like a detailed watchlist and planning page.
StockConsultant.com calls for a stop limit at 42.77, which would allow for a loss of 1.8% and an "Excellent" profit/loss ratio of about 7 to 1. It also warns that the potential for reaching the target is "Poor." Why? Because "there are two strong resistance areas on the way to Target 1." StockConsultant.com then presents data on the location, type, and strength of the resistance areas. If there is much more that a trader or investor wants to know before making a trade, then I'm not sure what else anyone could tell him (or her)!
The consultant's prescreen, search, portfolio, and charts
StockConsultant.com's PreScreen application allows traders and investors to screen a universe of thousands of stocks for a variety of up to 14 different technical conditions (Figure 2). These conditions, accessible by way of a pulldown menu on the PreScreen page, tend to be based on such technical factors as pullbacks and breakouts, support and resistance levels and strength, and "excessive drops." The results of the PreScreen search are provided in a PreScreen Search Report, which lists stock results by symbol, likely price range in ensuing move, volume range, profit range (expressed as a percentage), and the profit/loss ratio. Stocks in the PreScreen Search Reports can also be sorted by any of these criteria.
For those more advanced traders and investors -- or those for whom the PreScreen application simply is too limited -- StockConsultant.com also provides a SearchTool with advanced capabilities that allows traders and investors to create and save up to 25 of their own custom-built screens. For those looking to create stock screens without the extra work of having to learn a programming language, Stock-Consultant.com's SearchTool (Figure 3) is another example of the opportunities out there for the coding-agnostics.
StockConsultant.com also features a Portfolio (Figure 4) through which traders and investors can monitor the performance of stocks, sectors, indexes, or market averages. The Portfolio can function not only as a record of positions already taken, but also as a watchlist of stocks to purchase or sell short.
The Portfolio is arrayed in tabular form, with stock symbols to the left and information on price (including most recent daily change), volume, the nature of the recent price change (-10 to -3 represent different degrees of "down," -2 to +2 is considered "flat," and +3 to +10 represent different degrees of up), a three-day chart outlook (-10 is strong bearish, zero is neutral, +5 is mildly bullish, and so on), a short-term direction outlook (+9 is an extreme rally, -3 is a mild pullback, and so on), and an assessment of how overbought or oversold the stock is (Neutral, NeutralPlus, and NeutralMinus are the categories here).
Perhaps the Portfolio is most impressive in the way it helps organize information; it allows traders and investors, for example, to move swiftly from examination and comparison of various sectors to a closer look inside given sectors and back to a broader view of the market as a whole through a look at market averages. If sector rotation and "gaming the business cycle" are at all a part of your trading/investing methodology, then you will certainly be pleased at how easy StockConsultant.com has made the often-laborious task of wading through hundreds of stocks in a variety of sectors from airlines to computer storage.
I have already discussed StockConsultant.com's QuickCharts. But because these charts are available to StockConsultant.com apart from their role in the Consultant Report page, perhaps some additional comment and description of these charts is merited here. Traders and investors can "call up" stocks in QuickCharts by clicking on one of four tabs that represent stock indexes, daily stock leaders, sectors, the Dow industrials, and the top 30 components of the Qqq. Clicking on one of these tabs will bring up a set of links, each link representing a different stock. Clicking on these links will create a QuickChart of the selected stock.
QuickCharts default to a six-month view. Subscriber-supplied technical analysis options are relatively limited to bar versus candlestick, "log zoom," and the ability to add moving averages. That, however, does not mean that StockConsultant.com's QuickCharts don't provide a wealth of technical information. QuickCharts, for example, also function as "NewsCharts," which allow traders and investors to learn the news of any given day in the past six months by clicking on any price bar in the chart.
SmartVolume, RallyBands, and DualVolume are also a part of QuickCharts, as far as the locating of long and short targets and breakout points (based on the data from the Consultant Report) is concerned. QuickCharts also feature a summary box that relates the current stock price, major support area, one-day price change, current direction, extent of both "typical" rallies and pullbacks as well as "extreme" ones, the degree of overbought or oversold and the monthly trend. A one-year area chart of the chosen stock is also provided below the main, larger chart (Figure 5).
StockConsultant.com belongs to that cohort of trading/investing websites that has really pushed the envelope in terms of offering subscribers the kind of information about stocks and sectors that previously was available only to professionals -- or those amateurs and overachievers willing to engage in the Herculean task of collecting and compiling voluminous sets of data from a staggering variety of sources. While not every trader or investor will use every aspect of StockConsultant.com, it is hard to imagine a trader or investor not being able to take advantage of the fairly seamless integration of portfolio, consultant, search, and QuickChart -- and even harder to imagine a trader or investor whose stock picking and stock trading/investing would not be helped greatly by the tools StockConsultant.com has to offer.
--David Penn is Technical Writer for STOCKS & COMMODITIES.
Originally published in the May 2004 issue of Technical Analysis of STOCKS & COMMODITIES magazine. All rights reserved. © Copyright 2004, Technical Analysis, Inc.Return to Table of Contents