Tracking Fear In The Markets
Four Measures Of Market Volatility
by Frederic Ruffy
How do you read the CBOE's new measures of volatility? Find out here.
The CBOE volatility index (VIX) was last modified in September 2003. The Chicago Board Options Exchange (CBOE) reconstructed the index ahead of a planned launch of options and futures on the index. While the debut of these new options and futures products is expected in late March 2004 (as of this writing in early March) pending regulatory approval, the old VIX started appearing under the symbol VXO, and the new formula began, continuing the ticker symbol VIX.
Today, both indexes offer real-time information concerning implied volatility in the options market. In addition, traders can gauge volatility trends using two other relatively new indexes -- the Nasdaq 100 volatility index (VXN) and the Nasdaq QQQ volatility index (QQV). In order to make sense of all these volatility indexes, let's take a look at what they represent and what makes each one unique.
USING VOLATILITY
The CBOE launched the original VIX in 1993. Eleven years later, much has changed in the options markets, and as a result, the CBOE decided that it was tune-up time for the volatility index. The most significant change is that, while the old index was based on the implied volatility (IV) of Standard & Poor's 100 index (OEX) options, the new volatility index is derived from the more actively traded and liquid S&P 500 (SPX) options contract.
The shift from OEX to SPX options occurred because the S&P 500 is a more widely watched benchmark; it includes 500 companies (rather than 100 like the S&P 100), and encompasses roughly 80% of the US stock market. In addition, the SPX options contract sees more trading volume than the OEX. It is therefore considered a better gauge of what is truly happening in the options trading pits. For these reasons, the CBOE decided to change the underlying asset from the OEX, which was the first index options contract listed on the exchange in 1982, to the SPX when computing the new volatility index.
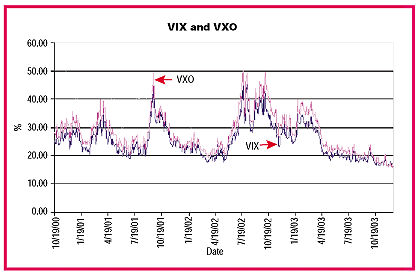
Figure 1: VIX and VXO. Both have been falling to low levels in late 2003.
...Continued in the May issue of Technical Analysis of
STOCKS & COMMODITIES
Excerpted from an article originally published in the May 2004 issue of Technical Analysis of STOCKS & COMMODITIES magazine. All rights reserved. © Copyright 2004, Technical Analysis, Inc.
Return to May 2004 Contents