April 2004
TRADERS' TIPS
You can copy these formulas and programs for easy use in your spreadsheet or analysis software. Simply "select" the desired text by highlighting as you would in any word processing program, then use your standard key command for copy or choose "copy" from the browser menu. The copied text can then be "pasted" into any open spreadsheet or other software by selecting an insertion point and executing a paste command. By toggling back and forth between an application window and the open Web page, data can be transferred with ease.
This month's tips include formulas and programs for:
or return to April 2004 ContentsTRADESTATION: Trend-Quality Indicator
TRADESTATION: TREND-QUALITY INDICATOR
David Sepiashvili's article in this issue, "Trend-Quality Indicator," describes a method of assessing trend strength. To accomplish this, Sepiashvili uses a summing process to determine the cumulative price change (CPC). The CPC is reset to zero at every trend reversal. Trend reversals are based on the crossing of two moving averages. The CPC is "piecewise" averaged to produce the trend, which in turn is compared to a noise calculation to produce the quality indicator.
The code given here performs these calculations. In order to match Figure 2 in Sepiashvili's article, the code plots the trend-noise balance indicator (B-indicator). To provide an indication of trend direction, a TrendPeriods indicator is included. It plots the periods variable.
Indicator:  TrendQuality
{ Calculating the Q-Indicator - As an example, we begin
  with a "fast" moving average length of 7 and a "slow"
  moving average length of 15 }
inputs:
 FastAvgLen( 7 ),
 SlowAvgLen( 15 ),
 M( 4 ), { % scalar trend period }
 N( 250 ), { % scalar noise period }
 Correction( 2 ) ; { % scalar correction factor }
variables:
 LPF1( 0 ),
 LPF2( 0 ),
 Reversals( 0 ),
 Periods( 0 ),
 DC( 0 ),
 CPC( 0 ),
 Trend( 0 ),
 DT( 0 ),
 Noise( 0 ),
  QIND( 0 ) ;
{ Generate reversal signals based on XAverage crossover rule }
LPF1 = XAverage( Close, FastAvgLen ) ;
LPF2 = XAverage( Close, SlowAvgLen ) ;
Reversals = LPF1 - LPF2 ;
Periods = Sign( Reversals ) ;
{ Calculate price minus previous price and compute
  cumulative sum over periods given by reversals }
DC = Close - Close[1] ;
if Periods <> Periods[1] then
 begin
 CPC = 0 ;
 Trend = 0 ;
 end
else
 begin
 CPC = CPC + DC * Periods ;
 { To calculate trend, smooth CPC by XAverage 4
   within the given segments (periods) }
 Trend = CPC * 1 / M + Trend[1] * ( 1 - ( 1 / M ) ) ;
 end ;
{ To calculate noise, subtract the trend from CPC, square it, and
   then smooth it }
DT = CPC - Trend ;
Noise = Correction * SquareRoot( Average( DT * DT, N ) ) ;
{ To calculate Q-indicator divide trend by obtained noise }
if Noise > 0 then
 QIND = Trend / Noise ;
if AbsValue( Trend ) + AbsValue( Noise ) > 0 then
 Plot1( AbsValue( Trend ) / ( AbsValue( Trend )
  + AbsValue( Noise ) ) * 100, "TrendQ" ) ;
Indicator:  TrendPeriods
inputs:
 FastAvgLen( 7 ),
 SlowAvgLen( 15 ) ;
variables:
 LPF1( 0 ),
 LPF2( 0 ),
 Reversals( 0 ),
 Periods( 0 ),
 DC( 0 ),
 CPC( 0 ) ;
LPF1 = XAverage( Close, FastAvgLen ) ;
LPF2 = XAverage( Close, SlowAvgLen ) ;
Reversals = LPF1 - LPF2 ;
Periods = Sign( Reversals ) ;
DC = Close - Close[1] ;
if Periods <> Periods[1] then
 CPC = 0
else
 CPC = CPC + DC * Periods ;
Plot2( Periods ) ;
An Eld file including this EasyLanguage strategy is available at www.tradestationworld.com. Look for the file "TrendQuality.eld." A sample chart is shown in Figure 1.
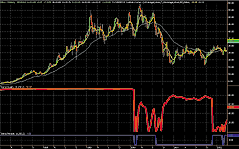
FIGURE 1:TRADESTATION, TREND-QUALITY INDICATOR. This sample TradeStation chart shows the trend-quality (Q-indicator) and trend-periods indicators on a weekly chart of Dell with seven-period and 15-period moving averages. The red line is the trend-quality indicator.
--Mark Mills
MarkM@TSSec at www.TradeStationWorld.com
EasyLanguage Questions Forum
TradeStation Securities, Inc.
A subsidiary of TradeStation Group, Inc.
METASTOCK: TREND-QUALITY INDICATOR
David Sepiashvili's article "Trend-Quality Indicator" introduces two new indicators: the Q-indicator and B-indicator. Both can be added to MetaStock using the formulas listed here.
To enter this indicator into MetaStock, do the following:
1. In the Tools menu, select Indicator Builder.
2. Click New to open the Indicator Editor for a new indicator.
3. Type the name of the formula.
4. Click in the larger window and type in the formula.
Name: Q-indicator:
Formula:
m:=Input("% Scalar trend period",1,25,4);
n:=Input("% Scalar noise period",1,500,250);
cf:=Input("% Scalar correction factor",1,250,2);
p1:=Input("First moving average periods",1,200,7);
p2:=Input("Second moving average periods",1,200,15);
rev:=Mov(C,p1,E)-Mov(C,p2,E);
pds:=If(rev>0,1,-1);
dc:=ROC(C,1,$);
cpc:=If(pds<>Ref(pds,-1),0,(dc*pds)+PREV);
trend:=If(pds<>Ref(pds,-1),0,(cpc*(1/m))+(PREV*(1-(1/m))));
dt:=cpc-trend;
noise:=cf*Sqrt(Mov(dt*dt,n,S));
trend/noise
Name: B-indicator
Formula:
m:=Input("% Scalar trend period",1,25,4);
n:=Input("% Scalar noise period",1,500,250);
cf:=Input("% Scalar correction factor",1,250,2);
p1:=Input("First moving average periods",1,200,7);
p2:=Input("Second moving average periods",1,200,15);
rev:=Mov(C,p1,E)-Mov(C,p2,E);
pds:=If(rev>0,1,-1);
dc:=ROC(C,1,$);
cpc:=If(pds<>Ref(pds,-1),0,(dc*pds)+PREV);
trend:=If(pds<>Ref(pds,-1),0,(cpc*(1/m))+(PREV*(1-(1/m))));
dt:=cpc-trend;
noise:=cf*Sqrt(Mov(dt*dt,n,S));
temp:=If(Abs(trend)+Abs(noise)=0,1,Abs(trend)+Abs(noise));
(Abs(trend)/temp)*100;

William Golson
Equis Support
Figure 2 shows how these indicators look on a chart of SPY.
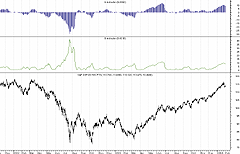
FIGURE 2: METASTOCK, TREND-QUALITY INDICATOR AND B-INDICATOR. Here are the Q-indicator and B-indicator on a chart of SPY.
--William Golson
Equis International
www.equis.com
CQG: TREND-QUALITY INDICATOR AND CUMULATIVE PRICE CHANGE INDICATOR
The Tqi_Cpc custom study has two curves, the CPC curve and the trend curve. There are three parameters: emaPeriod1, emaPeriod2, and m.
Note that the cumulative price change indicator (CPC) for uptrends is calculated separately from the CPC for downtrends, and they are then joined together at the end of the study.
For the trend curve, I calculated my own EMA of the CPC. This allowed
me to restart the calculation whenever the trend switched from up to down
or vice-versa. This prevents the tail end of one trend from affecting the
beginning of the next trend.
Cumulative price change indicator (CPC)
/*
* find the number of bars since the last cross-above and
* the last cross-below
*/
crossAbove := MA(@,Exp,emaPeriod1) XAbove MA(@,Exp,emaPeriod2);
crossBelow := MA(@,Exp,emaPeriod1) XBelow MA(@,Exp,emaPeriod2);
bsXA := BarsSince( crossAbove,1,400);
bsXB := BarsSince( crossBelow,1,400);
/*
* the market is going up if the number of bars since
* the last cross-above is less than the number of bars
* since the last cross-below and vice-versa
*/
up := bsXA < bsXB;
/*
* sum all of price changes since the last cross-above
*/
delta := Close(@) - Close(@)[-1];
cpcUp := IF( crossAbove, 0, cpcUp[-1]) + delta;
cpcDown := IF( crossBelow, 0, cpcDown[-1]) + delta;
cpc := IF( up, cpcUp, cpcDown);
cpc
Trend
/*
* calculate the 4-period exponential moving average of CPC.
* re-start the calculation every time there is a cross-above or
* a cross-below.
*/
crossAbove := MA(@,Exp,emaPeriod1) XAbove MA(@,Exp,emaPeriod2);
crossBelow := MA(@,Exp,emaPeriod1) XBelow MA(@,Exp,emaPeriod2);
bsXA := BarsSince( crossAbove,1,400);
bsXB := BarsSince( crossBelow,1,400);
/*
* the market is going up if the number of bars since the last
* cross-above is less than the number of bars since the last
* cross-below
*/
up := bsXA < bsXB;
/*
* calculate the smoothing constant for exp MA period
*/
sc := IF( m > 1, 2 / ( m + 1), m);
/*
* now calculate the trend
*/
cpc := TQI_CPC.CPC^(@,emaPeriod1,emaPeriod2);
expMA := IF( crossAbove OR crossBelow, cpc, ( 1 - sc) * expMA[-1] + sc * cpc);
expMA
Trend-quality indicator
The trend quality indicator has a single curve. In addition to the
parameters used in the CPC indicator just given, there are two additional
parameters, n and c.
Trend-quality indicator (Q-indicator)
/*
* calculate the "linear noise"
*/
dt := TQI_CPC.CPC^(@,emaPeriod1,emaPeriod2) - TQI_CPC.Trend^(@,emaPeriod1,emaPeriod2,m);
noise := c * MA(  Abs(dt),Sim,n);
/*
* now calculate the trend quality
*/
qi := TQI_CPC.Trend^(@,emaPeriod1,emaPeriod2,m) / noise;
qi
--Brian Bell, President
Custom Trading Solutions, Inc.
303 730-3388
AMIBROKER: TREND-QUALITY INDICATOR
In "Trend-Quality Indicator" in this issue, David Sepiashvili presents an innovative trend-detection tool -- the trend-quality indicator -- that attempts to estimate the trend in relation to noise.
Calculations presented in the article can be easily reproduced using AmiBroker Formula Language. The only tricky part is a piecewise exponential moving average that restarts the calculations on every moving average crossover, but we managed to implement it in two lines of code, thanks to AmiBroker's powerful Ama2 function, which allows easy implementation of all kinds of single-order infinite impulse response filters.
Listing 1 shows ready-to-use indicator code to plot the Q-indicator.
In AmiBroker, select Indicator Builder from the Analysis menu, click the
"Add" button, enter the formula, and then press "Apply." Figure 3 shows
a sample chart.
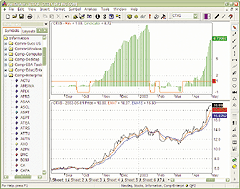
FIGURE 3: AMIBROKER, TREND-QUALITY INDICATOR. This AmiBroker screenshot shows the short-term Q-indicator on Citrix Systems [CTXS] (upper pane) and a line price chart with seven- and 15-day exponential moving averages (lower pane), which reproduces the chart presented in Sepiashvili's article.
LISTING 1
// Piecewise EMA is an EMA that restarts calculations each time
// the 'sincebar' argument is true
function PiecewiseEMA( array, range, sincebar )
{
  factor = IIf( sincebar, 1, 2/(range+1) );
  return AMA2( array, factor, 1-factor );
}
// parameters
m=4;
n=250;
// generate reversal signals based on EMA crossover rule
Lpf1 = EMA( C, 7  );
Lpf2 = EMA( C, 15 );
CrossPoint = Cross( Lpf1, Lpf2 ) OR Cross( Lpf2, Lpf1 );
Periods = BarsSince( CrossPoint );
// variable bar sum
DC = Close - Ref( Close, -1 );
CPC = Sum( DC, Periods );
// smooth CPC by piecewise 4 bar EMA
Trend = PiecewiseEMA( CPC, 4, CrossPoint );
// noise
DT = CPC - Trend;
Noise = 2 * sqrt( MA( DT^2, n ) );
// alternative 'linear' noise calculation
// Noise = 2 * MA( abs( DT ), n ) );
QIndicator = Trend/Noise;
Plot(sign(Lpf1-Lpf2), "Rev", colorRed );
Plot( Qindicator, "Qindicator", colorGreen, styleHistogram);
PlotGrid( -1 );
PlotGrid( 1 );
PlotGrid( 2 );
PlotGrid( -2 );
PlotGrid( 5 );
PlotGrid( 5);
--Tomasz Janeczko, AmiBroker.com
www.amibroker.com
eSIGNAL: TREND-QUALITY INDICATOR
This eSignal code implements the B-indicator and Q-indicator as described
in David Sepiashvili's article in this issue.
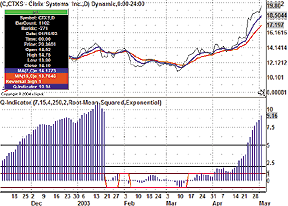
FIGURE 4: eSIGNAL, TREND-QUALITY INDICATOR. This sample eSignal chart plots David Sepiashvili's Q-indicator. Users should make sure they have enough data loaded into the chart to display this indicator properly. Users can either scroll the chart back to load more data, or set up a custom time template to load a fixed number of days, which should number at least 500.
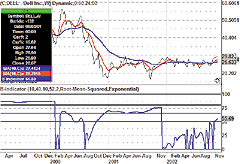
FIGURE 5: eSIGNAL, TREND-NOISE BALANCE INDICATOR. This sample eSignal chart plots David Sepiashvili's B-indicator.
/*****************************************************************
Provided By : eSignal. (c) Copyright 2004
Study:        B-Indicator
Version:      1.0
2/10/2004
Formula Parameters:              Default:
    MA1 Periods                     10
    MA2 Periods                     40
    Scalar Trend Periods         10
    Scalar Noise Periods         52
    Scalar Correction Factor       2
    Noise Type                        Root-Mean-Squared
    CPC Smoothing                 Exponential

Notes:
* This version uses an EMA(7)/EMA(15) crossover study for the basis of the indicator
  calculations in the background. To view the moving averages on the price pane, they
  must be applied separately with the same inputs for length.
* It is recommended that the advanced chart uses a custom time template equal to at
  least twice the number of bars than the length specified for the Scalar Noise Periods.
*****************************************************************/
function preMain() {
    setStudyTitle("B-Indicator ");
    setCursorLabelName("B-Indicator");

    setDefaultBarFgColor(Color.blue, 0);
    setDefaultBarThickness(2, 0);
    setComputeOnClose();

  setStudyMax(115);
    setStudyMin(-5);

    addBand(100, PS_SOLID, 2, Color.black, "100");
    addBand(80, PS_SOLID, 2, Color.black, "80");
    addBand(65, PS_SOLID, 2, Color.black, "65");
    addBand(50, PS_SOLID, 2, Color.red, "50");
    addBand(0, PS_SOLID, 2, Color.black, "0");

    var fp1 = new FunctionParameter("nLen1", FunctionParameter.NUMBER);
    fp1.setName("MA1 Periods");
    fp1.setLowerLimit(1);
    fp1.setDefault(10);
    var fp2 = new FunctionParameter("nLen2", FunctionParameter.NUMBER);
    fp2.setName("MA2 Periods");
    fp2.setLowerLimit(1);
    fp2.setDefault(40);
    var fp3 = new FunctionParameter("nTrendLen", FunctionParameter.NUMBER);
    fp3.setName("Scalar Trend Periods");
    fp3.setLowerLimit(1);
    fp3.setDefault(10);
    var fp4 = new FunctionParameter("nNoiseLen", FunctionParameter.NUMBER);
    fp4.setName("Scalar Noise Periods");
    fp4.setLowerLimit(1);
    fp4.setDefault(52);
    var fp5 = new FunctionParameter("nC", FunctionParameter.NUMBER);
    fp5.setName("Scalar Correction Factor");
    fp5.setLowerLimit(0);
    fp5.setDefault(2);

    var fp6 = new FunctionParameter("sType", FunctionParameter.STRING);
    fp6.setName("Noise Type");
    fp6.addOption("Linear");
    fp6.addOption("Root-Mean-Squared");
    fp6.setDefault("Root-Mean-Squared");
    var fp7 = new FunctionParameter("sCPCsmoothing", FunctionParameter.STRING);
    fp7.setName("CPC Smoothing");
    fp7.addOption("Simple");
    fp7.addOption("Exponential");
    fp7.setDefault("Exponential");
}
var bEdit = true;
var MAstudy1 = null;
var MAstudy2 = null;
var nRevPeriods = 0;
var aDC = null;
var aCPC = null;
var CPC = null;
var aDT = null;
var DT = null;
var vSign = null;
// EMA variables
var vEMA = null;
var vEMA1 = null;
var dPercent = 0.0;
var bPrimed = false;
function main(nLen1, nLen2, nTrendLen, nNoiseLen, nC, sType, sCPCsmoothing) {
    var nState = getBarState();
    var i = 0;
    var vC = close();
    var vC_1 = close(-1);
    if (vC_1 == null) return;
    var DC = 0;
    var Trend = 0;
    var Noise = 1;
    var dSum = 0;
    var dSum2 = 0;
    var vQ = null;
    var vB = null;

    if (bEdit == true) {
        MAstudy1 = new MAStudy(Math.round(nLen1), 0, "Close", MAStudy.EXPONENTIAL);
        MAstudy2 = new MAStudy(Math.round(nLen2), 0, "Close", MAStudy.EXPONENTIAL);
        if (aDC == null) aDC = new Array(1);
        if (aCPC == null) aCPC = new Array(Math.round(nTrendLen));
        if (aDT == null) aDT = new Array(Math.round(nNoiseLen));
        bEdit = false;
    }

    if (nState == BARSTATE_NEWBAR) {    // crossovers
        var vEMA1 = MAstudy1.getValue(MAStudy.MA, 0);
        var vEMA2 = MAstudy2.getValue(MAStudy.MA, 0);
        var vEMA1_1 = MAstudy1.getValue(MAStudy.MA, -1);
        var vEMA2_1 = MAstudy2.getValue(MAStudy.MA, -1);
        if (vEMA1 == null || vEMA2 == null || vEMA1_1 == null || vEMA2_1 == null) return;
        if ( (vEMA1 > vEMA2 && vEMA1_1 < vEMA2_1) || (vEMA1 < vEMA2 && vEMA1_1 > vEMA2_1) ) {
            nRevPeriods = 0;
            if ( (vEMA1_1 - vEMA2_1) > 0) vSign = -1;
            if ( (vEMA1_1 - vEMA2_1) < 0) vSign = +1;
            aDC = new Array(1);
            aCPC = new Array(Math.round(nTrendLen));
            CPC = null;
            bPrimed = false;
        } else {
            nRevPeriods += 1;
        }
        if (CPC != null) {
            aCPC.pop();
            aCPC.unshift(CPC);
        }
        if (DT != null) {
            aDT.pop();
            aDT.unshift(DT);
        }
    }

    // DC
    DC = (vC - vC_1);
    aDC[nRevPeriods] = DC;
    // CPC
    CPC = 0;
    for(i = 0; i < nRevPeriods+1; ++i) {
        CPC += aDC[i];
    }
    aCPC[0] = CPC

    // Trend
    if (nRevPeriods > 0) {
        if (sCPCsmoothing == "Exponential") {
            if (aCPC[nTrendLen-1] != null) {
                vEMA = EMA(nTrendLen, aCPC);
                Trend = vEMA;
            } else {
                for (i = 0; i < nRevPeriods+1; ++i) {
                    dSum2 += aCPC[i];
                }
                Trend = (dSum2/(nRevPeriods+1));
            }
        } else if (sCPCsmoothing == "Simple") {
            i = 0;
            for (i = 0; i < Math.min((nRevPeriods+1),nTrendLen); ++i) {
                dSum2 += aCPC[i];
            }
            Trend = (dSum2/Math.min((nRevPeriods+1),nTrendLen));
        }
    }

    // Noise
    if (sType == "Root-Mean-Squared") {
        DT = (CPC - Trend)*(CPC - Trend);
        aDT[0] = DT;
        if (aDT[nNoiseLen-1] != null) {
            i = 0;
            for (i = 0; i < nNoiseLen; ++i) {
                dSum += aDT[i];
            }
            dSum /= nNoiseLen;
            Noise = Math.sqrt(dSum) * nC;
        }
    } else if (sType == "Linear") {
        DT = Math.abs(CPC - Trend);
        aDT[0] = DT;
        if (aDT[nNoiseLen-1] != null) {
            i = 0;
            for (i = 0; i < nNoiseLen; ++i) {
                dSum += aDT[i];
            }
            dSum /= nNoiseLen;
            Noise = dSum * nC;
        }
    }

    // B-Indicator
    vB = (Math.abs(Trend) / (Math.abs(Trend)+Noise)) * 100;
    if (isNaN(vB)) vB = 100;
    return vB;
}
/***************
    Functions
****************/
function EMA(nLength, nArray) {
    var nBarState = getBarState();
    var dSum = 0.0;
    var dRef;
    if(nBarState == BARSTATE_ALLBARS || bPrimed == false) {
        dPercent = (2.0 / (nLength + 1.0));
        bPrimed = false;
    }
    if (nBarState == BARSTATE_NEWBAR) {
        vEMA1 = vEMA;
    }
    if(bPrimed == false) {
        for(i = 0; i < nLength; i++) {
            dSum += nArray[i];
        }
        bPrimed = true;
        return (dSum / nLength);
    } else {
        return (((CPC - vEMA1) * dPercent) + vEMA1);
    }
}
/*****************************************************************
Provided By : eSignal. (c) Copyright 2004
Study:        Q-Indicator
Version:      1.0
2/10/2004
Formula Parameters:                 Default:
    MA1 Periods                     7
    MA2 Periods                     15
    Scalar Trend Periods            4
    Scalar Noise Periods            250
    Scalar Correction Factor        2
    Noise Type                      Root-Mean-Squared
    CPC Smoothing                   Exponential

Notes:
    * This version uses an EMA(7)/EMA(15) crossover study for the
      basis of the indicator calculations in the background.  To
      view the moving averages on the price pane, they must be
      applied separately with the same inputs for length.
    * It is recommended that the advanced chart uses a custom time
      template equal to at least twice the number of bars than the
      length specified for the Scalar Noise Periods of 250.
*****************************************************************/
function preMain() {
    setStudyTitle("Q-Indicator ");
    setCursorLabelName("Reversal Sign", 0);
    setCursorLabelName("Q-Indicator", 1);
    setComputeOnClose();

    setPlotType(PLOTTYPE_HISTOGRAM, 1);
    setDefaultBarFgColor(Color.red, 0);
    setDefaultBarFgColor(Color.navy, 1);
    setDefaultBarThickness(2, 0);
    setDefaultBarThickness(3, 1);

    addBand(5, PS_SOLID, 2, Color.black, "+5");
    addBand(2, PS_SOLID, 2, Color.black, "+2");
    addBand(1, PS_SOLID, 2, Color.maroon, "+1");
    addBand(-1, PS_SOLID, 2, Color.maroon, "-1");
    addBand(-2, PS_SOLID, 2, Color.black, "-2");
    addBand(-5, PS_SOLID, 2, Color.black, "-5");

    var fp1 = new FunctionParameter("nLen1", FunctionParameter.NUMBER);
    fp1.setName("MA1 Periods");
    fp1.setLowerLimit(1);
    fp1.setDefault(7);
    var fp2 = new FunctionParameter("nLen2", FunctionParameter.NUMBER);
    fp2.setName("MA2 Periods");
    fp2.setLowerLimit(1);
    fp2.setDefault(15);
    var fp3 = new FunctionParameter("nTrendLen", FunctionParameter.NUMBER);
    fp3.setName("Scalar Trend Periods");
    fp3.setLowerLimit(1);
    fp3.setDefault(4);
    var fp4 = new FunctionParameter("nNoiseLen", FunctionParameter.NUMBER);
    fp4.setName("Scalar Noise Periods");
    fp4.setLowerLimit(1);
    fp4.setDefault(250);
    var fp5 = new FunctionParameter("nC", FunctionParameter.NUMBER);
    fp5.setName("Scalar Correction Factor");
    fp5.setLowerLimit(0);
    fp5.setDefault(2);

    var fp6 = new FunctionParameter("sType", FunctionParameter.STRING);
    fp6.setName("Noise Type");
    fp6.addOption("Linear");
    fp6.addOption("Root-Mean-Squared");
    fp6.setDefault("Root-Mean-Squared");
    var fp7 = new FunctionParameter("sCPCsmoothing", FunctionParameter.STRING);
    fp7.setName("CPC Smoothing");
    fp7.addOption("Simple");
    fp7.addOption("Exponential");
    fp7.setDefault("Exponential");
}
var bEdit = true;
var MAstudy1 = null;
var MAstudy2 = null;
var nRevPeriods = 0;
var aDC = null;
var aCPC = null;
var CPC = null;
var aDT = null;
var DT = null;
var vSign = null;
// EMA variables
var vEMA = null;
var vEMA1 = null;
var dPercent = 0.0;
var bPrimed = false;
function main(nLen1, nLen2, nTrendLen, nNoiseLen, nC, sType, sCPCsmoothing) {
    var nState = getBarState();
    var i = 0;
    var vC = close();
    var vC_1 = close(-1);
    if (vC_1 == null) return;
    var DC = 0;
    var Trend = 0;
    var Noise = 1;
    var dSum = 0;
    var dSum2 = 0;
    var vQ = null;

    if (bEdit == true) {
        MAstudy1 = new MAStudy(Math.round(nLen1), 0, "Close", MAStudy.EXPONENTIAL);
        MAstudy2 = new MAStudy(Math.round(nLen2), 0, "Close", MAStudy.EXPONENTIAL);
        if (aDC == null) aDC = new Array(1);
        if (aCPC == null) aCPC = new Array(Math.round(nTrendLen));
        if (aDT == null) aDT = new Array(Math.round(nNoiseLen));
        bEdit = false;
    }

    if (nState == BARSTATE_NEWBAR) {    // crossovers
        var vEMA1 = MAstudy1.getValue(MAStudy.MA, 0);
        var vEMA2 = MAstudy2.getValue(MAStudy.MA, 0);
        var vEMA1_1 = MAstudy1.getValue(MAStudy.MA, -1);
        var vEMA2_1 = MAstudy2.getValue(MAStudy.MA, -1);
        if (vEMA1 == null || vEMA2 == null || vEMA1_1 == null || vEMA2_1 == null) return;
        if ( (vEMA1 > vEMA2 && vEMA1_1 < vEMA2_1) || (vEMA1 < vEMA2 && vEMA1_1 > vEMA2_1) ) {
            nRevPeriods = 0;
            if ( (vEMA1_1 - vEMA2_1) > 0) vSign = -1;
            if ( (vEMA1_1 - vEMA2_1) < 0) vSign = +1;
            aDC = new Array(1);
            aCPC = new Array(Math.round(nTrendLen));
            CPC = null;
            bPrimed = false;
        } else {
            nRevPeriods += 1;
        }
        if (CPC != null) {
            aCPC.pop();
            aCPC.unshift(CPC);
        }
        if (DT != null) {
            aDT.pop();
            aDT.unshift(DT);
        }
    }

    // DC
    DC = (vC - vC_1);
    aDC[nRevPeriods] = DC;
    // CPC
    CPC = 0;
    for(i = 0; i < nRevPeriods+1; ++i) {
        CPC += aDC[i];
    }
    aCPC[0] = CPC

    // Trend
    if (nRevPeriods > 0) {
        if (sCPCsmoothing == "Exponential") {
            if (aCPC[nTrendLen-1] != null) {
                vEMA = EMA(nTrendLen, aCPC);
                Trend = vEMA;
            } else {
                i = 0;
                for (i = 0; i < nRevPeriods+1; ++i) {
                    dSum2 += aCPC[i];
                }
                Trend = (dSum2/(nRevPeriods+1));
            }
        } else if (sCPCsmoothing == "Simple") {
            i = 0;
            for (i = 0; i < Math.min((nRevPeriods+1),nTrendLen); ++i) {
                dSum2 += aCPC[i];
            }
            Trend = (dSum2/Math.min((nRevPeriods+1),nTrendLen));
        }
    }

    // Noise
    if (sType == "Root-Mean-Squared") {
        DT = (CPC - Trend)*(CPC - Trend);
        aDT[0] = DT;
        if (aDT[nNoiseLen-1] != null) {
            i = 0;
            for (i = 0; i < nNoiseLen; ++i) {
                dSum += aDT[i];
            }
            dSum /= nNoiseLen;
            Noise = Math.sqrt(dSum) * nC;
        }
    } else if (sType == "Linear") {
        DT = Math.abs(CPC - Trend);
        aDT[0] = DT;
        if (aDT[nNoiseLen-1] != null) {
            i = 0;
            for (i = 0; i < nNoiseLen; ++i) {
                dSum += aDT[i];
            }
            dSum /= nNoiseLen;
            Noise = dSum * nC;
        }
    }

    // Q-Indicator
    if (Noise != 0) {
        vQ = (Trend/Noise);
    }

    return new Array(vSign, vQ);
}
/***************
    Functions
****************/
function EMA(nLength, nArray) {
    var nBarState = getBarState();
    var dSum = 0.0;
    var dRef;
    if(nBarState == BARSTATE_ALLBARS || bPrimed == false) {
        dPercent = (2.0 / (nLength + 1.0));
        bPrimed = false;
    }
    if (nBarState == BARSTATE_NEWBAR) {
        vEMA1 = vEMA;
    }
    if(bPrimed == false) {
        for(i = 0; i < nLength; i++) {
            dSum += nArray[i];
        }
        bPrimed = true;
        return (dSum / nLength);
    } else {
        return (((CPC - vEMA1) * dPercent) + vEMA1);
    }
}
-Jason Keck
eSignal, a division of Interactive Data Corp.
800 815-8256, www.esignal.com
WEALTH-LAB: TREND-QUALITY INDICATOR
The trend-quality indicator (Q-indicator) and trend-noise balance indicator (B-indicator) described by David Sepiashvili in his article, "Trend-Quality Indicator," have been added to the Wealth-Lab code library and are available for download by selecting Community|Download ChartScripts from Wealth-Lab Developer's main menu. Website users also can employ both indicators in their ChartScripts by making the $Include references as given in the code shown in this tip.
The Trend Q, B system demonstrates how you can use the Q and B indicators to both join and exit a trend. As suggested by Sepiashvili, we constrain the trade entry to the conditions Q > 1 AND B > 50. While the system will exit a trade if B indicates the end of the trend by dropping to zero, we also include a trailing stop at the 100-period simple moving average. Following an exit, the system is inhibited from rejoining the same trend (Figure 6).
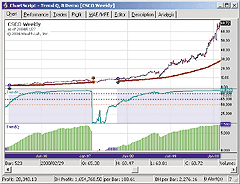
FIGURE 6: WEALTH-LAB, TREND-QUALITY INDICATORS. The Trend Q, B demo system uses the indicators to enter and exit the market.
Note that the Q and B scalar parameters, whose values are rather
arbitrary here, can be tweaked or optimized to improve performance.
{$I 'TrendB'}
{$I 'TrendQ'}
var Bar, TB, TQ, p, TBPane, TQPane, hMA: integer;
var EntryInhibit, TBExit: boolean;
hMA := SMASeries( #Close, 100 );
TB := TrendBSeries( #Close, 10, 40, 8, 250, 4, true );
TQ := TrendQSeries( #Close, 10, 40, 8, 250, 4, true );
{ --------
 Plot routine }
PlotStops;
HideVolume;
TBPane := CreatePane( 125, false, true );
TQPane := CreatePane( 125, false, true );
PlotSeriesLabel( TB, TBPane, #Teal, #Thick, 'TrendB' );
PlotSeriesLabel( TQ, TQPane, #Navy, #Histogram, 'TrendQ' );
DrawHorzLine( 50, TBPane, #Red, #Dotted );
DrawHorzLine( 65, TBPane, #Black, #Dotted );
DrawHorzLine( 80, TBPane, #Blue, #Dotted );
{ --------
 Demo system }
for Bar := 250 to BarCount - 1 do
begin
  if ( @TB[Bar] > 50 ) and ( @TQ[Bar] > 0 ) then
    SetPaneBackgroundColor( Bar, TBPane, #BlueBkg );
  if @TQ[Bar] > 1 then
    SetSeriesBarColor( Bar, TQ, #Green )
  else if @TQ[Bar] < -1 then
    SetSeriesBarColor( Bar, TQ, #Red );
  TBExit := false;
  if CrossUnderValue( Bar, TB, 0.1 ) then
  begin
    EntryInhibit := false;
    TBExit := true;
  end;
  if not LastPositionActive then
  begin   { Entry Rules }
    if not EntryInhibit then
      if ( @TQ[Bar] > 1 ) and ( @TB[Bar] > 50 )then
      begin
        EntryInhibit := true;
        BuyAtMarket( Bar + 1, '' );
      end;
  end
  else
  begin  { Exit Rules }
    p := LastPosition;
    if not SellAtStop( Bar + 1, @hMA[Bar], p, 'TStp' ) then
      if TBExit then
        SellAtMarket( Bar + 1, p, 'TB_Exit' );
  end;
end;
-- Robert Sucher, Wealth-Lab, Inc.
www.wealth-lab.com
NEUROSHELL TRADER: TREND-QUALITY INDICATOR
The trend-quality indicators described by David Sepiashvili can be easily
implemented in NeuroShell Trader by combining a few of NeuroShell Trader's
800 indicators and two custom indicators. To implement the Q-indicator
and B-indicator, select "New Indicator ..." from the Insert menu and use
the Indicator Wizard to create the following indicators:
REVERSAL:
    OR2 ( ExpCrossAbove(Close,7,15), ExpCrossBelow(Close,7,15) )
CPC:
    PiecewiseCumulativeChange ( Close, REVERSAL )
TREND:
    PiecewiseExpAvg ( CPC, REVERSAL, 4 )
DT:
    Sub ( CPC, TREND )
NOISE:
    Mult2 ( 2, Sqrt ( MovAvg ( Mult2 ( DT, DT ), 250 ) ) )
QINDICATOR:
    Divide ( TREND, NOISE )
BINDICATOR:
    Divide ( AbsoluteValue ( TREND ), Add2 ( AbsoluteValue ( TREND ), NOISE ) )
Note that the PiecewiseCumulativeChange and PiecewiseExpAvg indicators
are custom indicators.
Users of NeuroShell Trader can go to the Stocks & Commodities section of the NeuroShell Trader free technical support website to download the piecewise custom indicators as well as a sample chart that includes the trend-quality indicators.
A sample chart is shown in Figure 7.
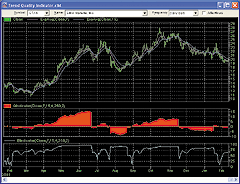
FIGURE 7: NEUROSHELL TRADER, TREND-QUALITY INDICATORS. This sample chart in NeuroShell Trader shows the Q-indicator (middle pane) and the B-indicator (bottom pane) on Citrix Systems [CTXS].
--Marge Sherald, Ward Systems Group, Inc.
301 662-7950, sales@wardsystems.com
www.neuroshell.com
AIQ TRADINGEXPERT: TREND-QUALITY INDICATOR
Here is the code for AIQ TradingExpert, based on David Sepiashvili's
article this issue.
!TREND QUALITY INDICATOR  by David Sepiahvilli (TASC Mar 2004)
!Coded by Rich Denning 2/09/04
m is 4.
n is 250.
c is 2.
LPF1 is expavg([close],7).
LPF2 is expavg([close],15).
Diff is LPF1 - LPF2.
Reversal if Diff > 0 and valresult(Diff,1) <= 0.
HD is Hasdatafor(2000).
Periods is scanany(Reversal, HD,0) then offsettodate(month(),day(),year()).
Date is scanany(Reversal, HD,0).
DC is [close] - val([close],1).
CPC is simpleavg(DC,^Periods,0) * ^Periods.
Trend is expavg(CPC,min(m,^Periods)).
DT is CPC - TREND.
NOISE is c * simpleavg(abs(DT),n).
QIND is TREND / NOISE.
--Rich Denning
AIQ Systems
NEOTICKER: TREND-QUALITY INDICATOR
The two indicators presented in "Trend-Quality Indicator" by David Sepiashvili, Q-indicator and B-indicator, can be implemented in NeoTicker using formula language.
Q-indicator
The NeoTicker formula language for the Q-indicator (Listing 1) has five parameters: period 1, period 2, m, n and c, in accordance to the code given in the article. Period 1 and Period 2 are the values used for generating the exponential moving average crossover rule, Periods. The Q-indicator is plotted as a histogram in a new pane.
To reproduce the chart shown in the article in NeoTicker, load CTXS daily data into a new chart. Add the Q-indicator to the data series (Figure 8).
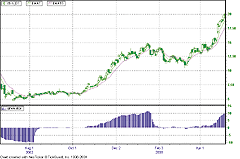
FIGURE 8: NEOTICKER, TREND-QUALITY INDICATOR. Here's a sample chart in NeoTicker.
B-indicator
The NeoTicker formula language for the B-indicator (Listing 2) also has five parameters: period 1, period 2, m, n, and c. These parameters are used to generate the trend and noise values. The B-indicator is plotted as a line in the new pane (Figure 9).
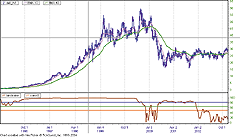
FIGURE 9: NEOTICKER, TREND-NOISE BALANCE INDICATOR. Here's the B-indicator as plotted in NeoTicker.
A downloadable version of the indicators will be available from the Yahoo! NeoTicker user group file area at https://groups.yahoo.com/group/neoticker/.LISTING 1 LPF1 := qc_xaverage(c, param1); LPF2 := qc_xaverage(c, param2); REVERSAL := LPF1-LPF2; PeriodA := if((REVERSAL > 0) and (REVERSAL(1) <= 0), 0, PeriodA+1); PeriodB := if((REVERSAL < 0) and (REVERSAL(1) >= 0), 0, PeriodB+1); PERIODS := if(REVERSAL > 0, PeriodA, PeriodB); DC := c-c(1); CPC := varsum(DC,PERIODS); TREND := qc_xaverage(CPC, param3); myDT := CPC - TREND; myDT_abs := absvalue(myDT); NOISE := param5*average(myDT_abs, param4); plot1 := TREND/NOISE; LISTING 2 LPF1 := qc_xaverage(c, param1); LPF2 := qc_xaverage(c, param2); REVERSAL := LPF1-LPF2; PeriodA := if((REVERSAL > 0) and (REVERSAL(1) <= 0), 0, PeriodA+1); PeriodB := if((REVERSAL < 0) and (REVERSAL(1) >= 0), 0, PeriodB+1); PERIODS := if(REVERSAL > 0, PeriodA, PeriodB); DC := c-c(1); CPC := varsum(DC,PERIODS); TREND := qc_xaverage(CPC, param3); myDT := CPC - TREND; myDT_abs := absvalue(myDT); NOISE := param5*average(myDT_abs, param4); plot1 := if((absvalue(TREND)+absvalue(NOISE)) > 0, absvalue(TREND)/(absvalue(TREND)+absvalue(NOISE))*100, 0); success1 := if((absvalue(TREND)+absvalue(NOISE)) > 0, 1, 0);
--Kenneth Yuen, TickQuest Inc.
www.tickquest.com
PROPHET.NET: TREND-QUALITY INDICATOR
The two indicators, trend-quality and trend-noise balance, described by David Sepiashvili in his article in this issue, are available on the Prophet.Net website to all premium members. No coding is required on the part of the user.
The trend-quality indicator (Q-indicator) shows the direction and strength of a trend. The trend-noise balance indicator (B-indicator), also shows the trend, but indicates overbought and oversold conditions as well. For one-click access to these indicators, go to JavaCharts from your computer's browser:
  Prophet.Net : Analyze : JavaCharts
  https://www.prophet.net/analyze/javacharts.jsp
Click on the Tools menu (which you can also access by right-clicking anywhere on a chart) and choose "Apply studies" from the Studies menu item. The list of available studies (approximately 150 of them, shown in alphabetical order) are in the second dropdown menu; you can choose trend-quality and trend-noise balance from this list. You may also adjust the parameters for either of these studies if you desire.
Figure 10 shows an example of the QQQ chart over a nine-month period with both of these indicators applied. Note that with the Q-indicator, red horizontal lines are provided to show the significant values cited in the article (-5, -2, +2, and +5) to determine trend strength.
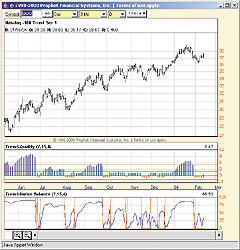
FIGURE 10: PROPHET.NET, TREND-QUALITY INDICATORS. Here's a sample QQQ chart with the Q-indicator and B-indicator plotted. Note that with the Q-indicator, red horizontal lines show the significant values with which to determine trend strength.
Premium memberships at Prophet.Net start at $14.95 per month; real-time market data is available for equities, options, and futures. The following link will provide immediate access to all premium studies: https://www.prophet.net/tasc
--Prophet.netGO BACK
TECHNIFILTER PLUS: TREND-QUALITY INDICATOR
Here are the formulas and a filter report for TechniFilter Plus based on the trend-quality indicator (Figure 11) and B-indicator (Figure 12) discussed in David Sepiashvili's article in this issue. To use different time periods, simply change the parameter as required.
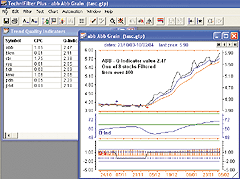
FIGURE 11: TECHNIFILTER PLUS, TREND-QUALITY INDICATOR. Here's a sample chart of the Q-indicator in TechniFilter Plus.
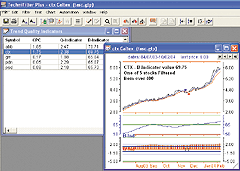
FIGURE 12: TECHNIFILTER PLUS, TREND-NOISE BALANCE INDICATOR. Here's a sample chart of the B-indicator in TechniFilter Plus.
Formulas
NAME: CPC
SWITCHES: multiline
PARAMETERS: 7,15,4,0.5,250
FORMULA:
[1]: ((((cx&1-cx&2)u2)=1)*((((cx&1-cx&2)u2)=1)U7))+((1-(((cx&1-cx&2)u2)=1))*((((cx&1-cx&2)u3)=-1)U7)) {Periods}
[2]: C-Cy1  {DC}
[3]: [2]F[1]{CPC}
NAME: Q-Indicator
SWITCHES: multiline
PARAMETERS: 7,15,4,0.5,250
FORMULA:
[1]: ((((cx&1-cx&2)u2)=1)*((((cx&1-cx&2)u2)=1)U7))+((1-(((cx&1-cx&2)u2)=1))*((((cx&1-cx&2)u3)=-1)U7)) {Periods}
[2]: C-Cy1  {DC}
[3]: [2]F[1]{CPC}
[4]: ([3]x&3)x[1] {Trend}
[5]: [3]-[4] {DT}
[6]: ([5]u0X&5)* &4{Noise}
[7]: [4]/[6]{c}{NQ-Ind}{nc}{a}{h}  {rgb#255}
NAME: B-Indicator
SWITCHES: multiline
PARAMETERS: 7,15,4,0.5,250
FORMULA:
[1]: ((((cx&1-cx&2)u2)=1)*((((cx&1-cx&2)u2)=1)U7))+((1-(((cx&1-cx&2)u2)=1))*((((cx&1-cx&2)u3)=-1)U7)) {Periods}
[2]: C-Cy1  {DC}
[3]: [2]F[1]{CPC}
[4]: (([3]x&3)x[1])u0{Trend}
[5]: [3]-[4] {DT}
[6]: (([5]u0X&5)* &4)u0{Noise}
[7]: ([4]/([4]+[6]))*100{c}{NB-Ind}{nc}{a}  {rgb#16711680}
Trend-quality indicator filter /screening report
The following filter report (see sample in Figure 13) can be used to scan a database and then filter out those issues that meet the required Q-indicator or B-indicator limits.
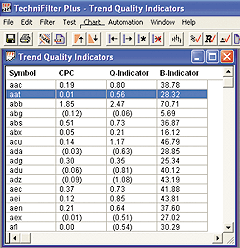
FIGURE 13: TECHNIFILTER PLUS, FILTER COMPUTED Report. Note the latest values for the Q-Indicator and B-Indicator.
NAME: Trend Quality Indicator
UNITS TO READ: 750
FORMULAS
--------

  [1] Symbol
  [2] CPC(7,15,4,0.5,250)
   [1]: ((((cx&1-cx&2)u2)=1)*((((cx&1-cx&2)u2)=1)U7))+
   (1-(((cx&1-cx&2)u2)=1))*((((cx&1-cx&2)u3)=-1)U7)) {Periods}
   [2]: C-Cy1  {DC}
   [3]: [2]F[1]{CPC}
[3] Q-Indicator(7,15,4,0.5,250)
   [1]: ((((cx&1-cx&2)u2)=1)*((((cx&1-cx&2)u2)=1)U7))+
   ((1-(((cx&1-cx&2)u2)=1))*((((cx&1-cx&2)u3)=-1)U7)) {Periods}
   [2]: C-Cy1  {DC}
   [3]: [2]F[1]{CPC}
   [4]: ([3]x&3)x[1] {Trend}
   [5]: [3]-[4] {DT}
   [6]: ([5]u0X&5)* &4{Noise}
   [7]: [4]/[6]
[4] B-Indicator(7,15,4,0.5,250)
   [1]: ((((cx&1-cx&2)u2)=1)*((((cx&1-cx&2)u2)=1)U7))+
   ((1-(((cx&1-cx&2)u2)=1))*((((cx&1-cx&2)u3)=-1)U7)) {Periods}
   [2]: C-Cy1  {DC}
   [3]: [2]F[1]{CPC}
   [4]: (([3]x&3)x[1])u0{Trend}
   [5]: [3]-[4] {DT}
   [6]: (([5]u0X&5)* &4)u0{Noise}
   [7]: ([4]/([4]+[6]))*100
FILTERS--------

[1] Q_Weak Trending UP
[3] >= 1  & [3] <= 2
[2] Q_moderate Trending UP
[3] >= 2  & [3] <= 5
[3] Q_Strong Trending UP
[3] > 5
[4] Q_Weak TrendingDown
[3] <= -1  & [3] >= -2
[5] Q_Moderate TrendingDown
[3] <= -2  & [3] >= -5
[6] Q_Strong Trending Down
[3] <- 5
[7] B_Weak Trending UP
[4] >= 50  & [3] <= 65
[8] B_Moderate Trending UP
[4] >65  & [3] <= 80
[9] B_Strong Trending UP
[4] >80
Visit the new home of TechniFilter Plus at www.technifilter.com
to download these reports and formulas.
--Benzie Pikoos
Brightspark
Tel +61 8 9375-1178, sales@technifilter.com
www.technifilter.com
TRADE NAVIGATOR: TREND-QUALITY INDICATOR
David Sepiashvili's article "Trend-Quality Indicator" examines trend detection and strength in a new way by introducing the trend-quality indicator (Figure 14).
FIGURE 14: TRADE NAVIGATOR, Q-INDICATOR. This sample Trade Navigator chart shows the Q-indicator along with the reversal indicator on an IBM daily chart.
Here is the TradeSense code for five indicators: reversal, cumulative price change (CPC), trend, noise, and the Q-indicator. The formulas are intended for use within the Trade Navigator Gold and Platinum versions, but we could also provide a special file for Trade Navigator Silver users.
To enter each of these indicators into Trade Navigator, first pull up your Traders Toolbox. Continue to the Functions tab, and click on New. You will now have a New Function window (Figure 15) where you will enter the formula for the reversal function.
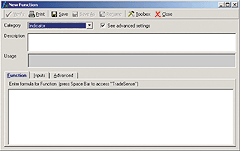
FIGURE 15: TRADE NAVIGATOR, Q-INDICATOR. Enter the formula for the reversal function in the New Function window. To create the next function, go back to the toolbox by clicking the Toolbox button.
In order to calculate CPC trend, noise and Q-indicator, you must first create the reversal function. The reversal function uses an exponential moving average crossover rule to generate starting points for the CPC indicator. Once you finish typing in the formula, click on Save, and name it appropriately. To create the next function, go back to the toolbox by clicking the Toolbox button (Figure 15), and click the New button on the Functions tab. Each of these indicators, once created, can be added to the charts by clicking the letter "A" on the keyboard, selecting the Indicators tab, and then double-clicking on the name of the desired indicator.
Note: Each indicator has inputs that need to be defined
on the Inputs tab of the Function editor (please see the default values
for inputs under each formula).
Reversal
Formula:
Sign (MovingAvgX (Close , XMA1) - MovingAvgX (Close , XMA2))
Default values for inputs:
XMA1 = 7
XMA2 = 15
CPC
Formula:
CumulativeSum (Close - Close.1 , 0) - CumulativeSum (Close - Close.1 , 0)
Bars Since (Reversal (XMA1 , XMA2) <> Reversal (XMA1 , XMA2).1 , 1 , 0)
Default values for inputs:
XMA1 = 7
XMA2 = 15
Trend
Formula:
MovingAvgX (CPC (XMA1 , XMA2) , TrendPeriod)
Default values for inputs:
XMA1 = 7
XMA2 = 15
TrendPeriod = 4
Noise
Formula:
CorrFactor * SqrRoot (MovingAvg ((CPC (XMA1 , XMA2) - Trend (XMA1 , XMA2 ,
 TrendPeriod)) * (CPC (XMA1 , XMA2) - Trend (XMA1 , XMA2 , TrendPeriod)) ,
 NoisePeriod))
Default values for inputs:
CorrFactor = 2
XMA1 = 7
XMA2 = 15
TrendPeriod = 4
NoisePeriod = 250
QIndicator
Formula:
Trend (XMA1 , XMA2 , TrendPeriod) / Noise (NoisePeriod , CorrFactor , XMA1 ,
 XMA2 , TrendPeriod)
Default values for inputs:
NoisePeriod = 250
CorrFactor = 2
XMA1 = 7
XMA2 = 15
TrendPeriod = 4
For more information on Trade Navigator, please visit www.GenesisFT.com.
--Chad Noble
GFT Strategic Development
Genesis Financial Technologies, Inc.
CNoble@GFDS.com
719 884-0245, Support@GFDS.com
All rights reserved. © Copyright 2004, Technical Analysis, Inc.
Return to April 2004 Contents