Not Fade Away
Tiny Chart Patterns: Stinkers Or Stalwarts?
by Thomas N. Bulkowski
Recognizing tiny chart patterns may be all the edge you need to make a killing in the market, but do they work?
In two prior articles, I discussed bullish chart patterns of long duration. This article discusses smaller chart patterns: some you may have heard about, and some that may be new to you. None of the patterns is longer than a few days. Daytraders in stocks or commodities may find them useful, but some of the patterns may also help longer-term investors. Sometimes these tiny patterns can tip you off to a large move ahead. They can signal a trend reversal and save you a ton of money. So what are these mysterious chart patterns?
INSIDE DAYS
All figures in this article show high-low-close prices -- that is, no
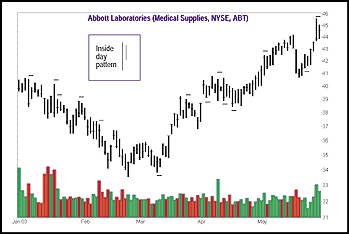
opening price. Figure 1 illustrates our first pattern, inside days, on
the daily scale. Look at the inset for a closer view of the pattern. An
inside day is within the boundary of the prior day's range (hence its name).
The second day has a lower high and higher low -- a narrowing of the price
range. No ties are allowed (the two days cannot share the same high or
low price). Where the stock opens or closes is not important, and the second
day need not be centered in the first day's price range. The inset shows
the second day's price range to be above the midpoint of the prior day.

FIGURE 1: AN INSIDE DAY. The range of the second day of the pattern is inside the daily price range of the prior day. When the pattern works, a large move occurs the following day, as shown in early March. The horizontal lines highlight examples of the pattern.
...Continued in the April issue of Technical Analysis
of STOCKS & COMMODITIES
Excerpted from an article originally published in the April 2004 issue of Technical Analysis of STOCKS & COMMODITIES magazine. All rights reserved. © Copyright 2004, Technical Analysis, Inc.
Return to April 2004 Contents