CHART PATTERNS
Swing Lo
Swing Trading With Swing Charts
by Teresa Lo
Here's how you can use swing charts as an indispensable tool for all your trading.
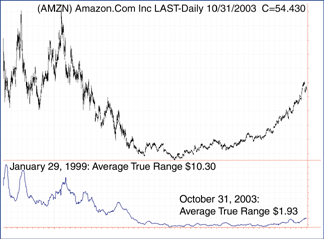
Of late, swing trading has caught the attention of many market participants. This migration of traders from "day" to"swing" trading has most likely been caused by the severe contraction of price movement in most stocks and stock indexes over the past few years. For example, Amazon (Figure 1) is a typical high-profile Internet stock. On January 29, 1999, Amazon's 20-day average true range (ATR) was $10.30. As of October 31, 2003, the value was $1.93. Roughly, this means it now takes more than a week for Amazon to cover the amount of movement that it used to cover in a single day back during the market frenzy, rendering intraday trading quite a bit less profitable than it used to be.
While there seems to be no lack of information offered on the subject of swing trading, the meaning of the term swing is often unclear. Let me provide some insight into how to use swing charts as an indispensable tool not only for swing trades but also for any type of trading.
BAR-BASED SWING REVERSAL
Prior to the widespread use of computers, two traders laid the groundwork for defining swing based on the actual price action observed in the markets. One name that will forever be associated with swing charts is W.D. Gann. In the same era, technician William Dunnigan conducted research into the nature of trends and reversals, but did not construct swing charts per se. In recent years, the late Robert Krausz (author, trader, and STOCKS & COMMODITIES contributor) implemented what is thought to be an alteration that Gann made to the method.
What these traders did was make specific rules about what constitutes an important price reversal. In doing so, they also defined a swing. For Gann and Krausz, if two consecutive bars made lower lows, a downswing would be triggered, while an upswing would be triggered if two consecutive bars made higher highs. Dunnigan imposed more conditions, but what they all have in common is that swing reversals were deemed to have occurred by the appearance of specific price bar combinations; therefore, the same formula could be used across all time frames and markets. The point is driven home by the title of Dunnigan's last book, One-Way Formula For Trading In Stocks And Commodities, written shortly before his death in 1957.

FIGURE 1: THE REASON SWING TRADING IS GAINING POPULARITY. It takes more than a week for this stock to cover the amount of movement it used to cover in a single day.
...Continued in the February issue of Technical Analysis of STOCKS & COMMODITIES
Excerpted from an article originally published in the February 2004 issue of Technical Analysis of STOCKS & COMMODITIES magazine. All rights reserved. © Copyright 2004, Technical Analysis, Inc.
Return to February 2004 Contents