CHARTING
The Reversal Date Indicator
Predict, Identify, and Trade Future Market Swings
by John Crane
The key to swing trading is in the timing of your entry and exit. But how do you identify them? The answer may be in front of you.
In an age where faster computers and advanced software are providing access to more information at lightning speed, traders are busy creating new technical tools and testing ideas. Technology has produced many changes in today's market world, resulting in an explosion in the number of new traders who are seeking the ultimate short-term trading strategy. Daytrading and swing trading have become buzzwords for a new generation of traders who flock to online trading and embrace every new software program that promises trading success. The marketplace is full of sophisticated trading systems, but has any of this advanced technology made people more successful?
In the late 1990s many new traders jumped online, bought software programs, and started to trade their way to riches. It was a great time to enter the market, but all too often these new traders confused a bull market with trading savvy. As soon as the market topped, so did their trading accounts, because they lacked an important ingredient for success: a working understanding of market behavior.
Trading technically
More than 20 years ago, I attended my first seminar on technical analysis. I walked away with extensive knowledge about one magic indicator: the trendline. That was all I needed, or so I thought. But like other new traders, I quickly realized I needed more. This led to an extensive study of chart patterns, cycles, and technical indicators. I kept studying, adding more and more clutter to my trading toolbox. Soon, my computer screen was muddled with charts and technical indicators.
How I longed for the earlier days when things were so much simpler. Back then, I would sit back and dream about the type of chart I'd like to see. It would have fewer technical indicators. It would highlight the future turning points and provide the price levels where the market reversal would occur. I would be able to pull up any chart and see both the time and the price where the market would most likely turn, long before it happened. Then a line would appear to identify the price level where time and price would likely converge. The chart itself would predict and identify future market swings based on market behavior.
But that was all a dream - or was it?

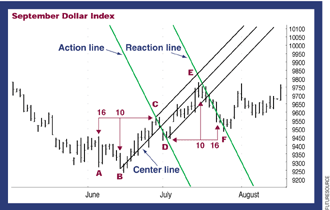
FIGURE 1: PREDICTING FUTURE SWING POINTS. By constructing action/reaction lines and by reverse counting price bars, it is possible to predict where the next high and low of the swing will take place.
...Continued in the February issue of Technical Analysis of STOCKS
& COMMODITIES
Excerpted from an article originally published in the February 2004 issue of Technical Analysis of STOCKS & COMMODITIES magazine. All rights reserved. © Copyright 2004, Technical Analysis, Inc.
Return to February 2004 Contents