August 2002
TRADERS' TIPS
You can copy these formulas and programs for easy use in your spreadsheet or analysis software. Simply "select" the desired text by highlighting as you would in any word processing program, then use your standard key command for copy or choose "copy" from the browser menu. The copied text can then be "pasted" into any open spreadsheet or other software by selecting an insertion point and executing a paste command. By toggling back and forth between an application window and the open Web page, data can be transferred with ease.
This month's tips include formulas and programs for:
TRADESTATION: ZIGZAG VALIDITY
eSIGNAL: CENTER OF GRAVITY OSCILLATOR
WEALTH-LAB: CENTER OF GRAVITY OSCILLATOR
WEALTH-LAB: ZIGZAG VALIDITY
WEALTH-LAB: RSI SYSTEM
NEUROSHELL TRADER: CENTER OF GRAVITY OSCILLATOR
NEUROSHELL TRADER: ZIGZAG VALIDITY
NEUROSHELL TRADER: RSI SYSTEM
NEOTICKER: CENTER OF GRAVITY OSCILLATOR
NEOTICKER: ZIGZAG VALIDITY
NEOTICKER: RSI SYSTEM
AIQ: CENTER OF GRAVITY OSCILLATOR
INVESTOR/RT: ZIGZAG VALIDITY
INVESTOR/RT: RSI SYSTEM
TRADINGSOLUTIONS: RSI SYSTEM
TECHNIFILTER PLUS: CENTER OF GRAVITY OSCILLATOR
SMARTRADER: CENTER OF GRAVITY OSCILLATOR
WAVE WI$E MARKET SPREADSHEET: CENTER OF GRAVITY OSCILLATOR
WAVE WI$E MARKET SPREADSHEET: ZIGZAG VALIDITY
WAVE WI$E MARKET SPREADSHEET: RSI SYSTEM
or return to August 2002 Contents
![]() TRADESTATION:
ZIGZAG VALIDITY
TRADESTATION:
ZIGZAG VALIDITY
In "Zigzag Validity" in this issue, author Spyros Raftopoulos has based his discussion on a particular implementation of the zigzag indicator. The weakness of the implementation discussed is that at any time, the most recent two legs of the indicator may be dynamic legs. The most recent reversal may appear and disappear as new bars are formed, and the reversal is not locked in until it exceeds the indicator sensitivity. Once the reversal is locked in, the slope and extent of this leg can still change as new swings appear. The slope of this leg gets locked in when the next reversal gets locked in.
So in general, the most recent leg is completely dynamic -- that is, its slope can change, or it can simply disappear (if its direction changes); the second most recent leg has its direction fixed to either up or down, but its slope can change; and all legs preceding that are completely fixed. The validation indicator proposed by the author is designed to indicate when the most recent reversal has been locked in.
The zigzag % indicator in TradeStation 6 has been implemented in a way that obviates the need for a companion validation indicator. The TS6 implementation does not draw the most recent reversal leg at all until it has been locked in. All the legs that are drawn already have their up/down directions locked in, though the slope and extent of the most recent leg can change as new swings appear that extend the trend.
The algorithm used for the zigzag % indicator in TradeStation 6 is as
follows (if you have TS6, you can view the actual code via the PowerEditor):
If just confirmed new SwingHigh then

 Begin

 If downtrend then check if reversal confirmed

 If uptrend than check if trend extended

 End

Else if just confirmed new SwingLow then

 Begin

 If uptrend then check if reversal confirmed

 If downtrend then check if trend extended

 End

If reversal confirmed than add reversal trendline

If trend extended then update most recent trendline
Note: Since this code is available as a built-in indicator in TradeStation
6, it won't be posted at www.tradestation2000i.com.
--Ramesh Dhingra
Director, EasyLanguage Consulting
TradeStation Technologies, Inc. (formerly Omega Research, Inc.)
a wholly owned subsidiary of TradeStation Group, Inc.
www.TradeStation.com
![]() eSIGNAL:
CENTER OF GRAVITY OSCILLATOR
eSIGNAL:
CENTER OF GRAVITY OSCILLATOR
This eSignal formula plots the center of gravity oscillator, which was presented by John Ehlers in the May 2002 S&C. A sample chart can be seen in Figure 1.
Figure 1: eSIGNAL, CENTER OF GRAVITY OSCILLATOR. This plots the center of gravity oscillator for the June contract of the US bond on a historical chart. It's an example of a custom eSignal Formula Script (EFS) that can be written and modified in any text editor or within the eSignal formula editor.
/********************************************************************************
Description: This formula plots the Center of Gravity Oscillator
Provided By: This formula was created in the eSignal Formula Editor
Copyright 2002 eSignal, A division of Interactive Data Corporation
*********************************************************************************/
GO BACKfunction preMain() { setStudyTitle("CG Oscillator"); setCursorLabelName("CG-Osc", 0); setCursorLabelName("CG-Osc1", 1); setDefaultBarFgColor(Color.red, 0); setDefaultBarFgColor(Color.blue, 1); //setDefaultBarThickness(2, 0); //setDefaultBarThickness(2, 1); } > function main(nInputLength) { if(nInputLength == null) nInputLength = 10; > var vRef; var nCount; var dDenom = 0; > var dNum = 0; > var dCG = 0; > var vH, vL; var vPrice; vH = high(0, -nInputLength); > vL = low(0, -nInputLength); > if(vH == null || vL == null) return; for(nCount = 0; nCount < nInputLength; nCount++) { vPrice = (vH[nCount] + vL[nCount]) / 2 > dNum += (1 + nCount) * vPrice; > dDenom += vPrice; > } if(dDenom != 0) > dCG = -dNum / dDenom; > vRef = ref(-1); > if(vRef == null) { return new Array(dCG, null); } else { return new Array(dCG, vRef[0]); } } >--eSignal, a division of Interactive Data Corp.
800 815-8256, www.esignal.com
![]() WEALTH-LAB:
CENTER OF GRAVITY OSCILLATOR
WEALTH-LAB:
CENTER OF GRAVITY OSCILLATOR
The center of gravity (CG) indicator, which John Ehlers described in his article in the May 2002 S&C, can be an excellent short-term timing tool. We created a trading system that utilizes CG to trigger buys after a sufficient amount of downward price pressure is detected. A sample chart can be seen in Figure 2.

FIGURE 2: Wealth-Lab, CENTER OF GRAVITY. Here is a sample chart of the center of gravity oscillator in Wealth-Lab.
To measure downward pressure, we use the CumDown function to count
the number of consecutive bars for which the close is lower than the close
four bars ago (a technique adapted from Tom DeMark's Sequential
and Combo setups).
The script that follows colors the bars based on the downward pressure. The higher the pressure, the greater the intensity of blue is used to color the bar.
When downward pressure is 5 or higher, we look to the CG indicator crossing
its one-bar offset to pull the trigger. Since this system is intended to
capitalize on short-term moves, we employ a 3% profit target exit. We also
exit the position if the CG crosses back below its one-bar offset.
{$I 'CG'}

var Bar, CGSer, CGOffset, CGPane: integer;

var Pressure: float;

{ Plot Center of Gravity and it's 1 Bar Offset }

CGPane := CreatePane( 100, true, true );

CGSer := CGSeries( #Average, 10 );

PlotSeries( CGSer, CGPane, #Maroon, #Thick );

DrawLabel( 'CG(Average,10)', CGPane );

CGOffset := OffsetSeries( CGSer, -1 );

PlotSeries( CGOffset, CGPane, #Teal, #Thick );

{ Install a 3% Profit Target }

InstallProfitTarget( 3 );

{ Begin Trading System Rules }

for Bar := 20 to BarCount - 1 do

begin

  ApplyAutoStops( Bar );

{ Close Long Position when CG Crosses its Offset }

  if LastPositionActive then

  begin

    if CrossUnder( Bar, CGSer, CGOffset ) then

      SellAtMarket( Bar + 1, LastPosition, '' );

  end

  else

  begin

{ Calculate market pressure }

    Pressure := CumDown( Bar, #Close, 4 );

    if Pressure > 9 then

      Pressure := 9;

    SetBarColor( Bar, Round( Pressure ) );

{ Sufficient downward pressure to look for entry signal? }

    if Pressure > 5 then

{ Yes, enter long on CG crossover }

      if CrossOver( Bar, CGSer, CGOffset ) then

        BuyAtMarket( Bar + 1, '' );

  end;

end;
--Dion Kurczek, Wealth-Lab, Inc.GO BACK
www.wealth-lab.com
![]() WEALTH-LAB: ZIGZAG VALIDITY
WEALTH-LAB: ZIGZAG VALIDITY
In his article "ZigZag Validity" in this issue, Spyros Raftopoulos relates some very important considerations to keep in mind when using the zigzag indicator. Zigzag makes it easy to visualize swing highs and lows, but it works in hindsight. Each swing high and low is detected only after a lag that can extend for several bars.
In Wealth-Lab, you access the zigzag by utilizing a set of functions that return peaks and troughs on the chart. You can access the most recent peak and trough (or previous ones), as well as the bar at which the peak/trough was established. But more important, the functions work in a walk-forward manner. They return the peak/trough as it was known at the bar being queried, instead of using hindsight. This feature makes it possible to write trading systems that are based on peaks and troughs, as long as you realize the impact introduced by the lag.
The following script gives you an idea of how much lag you can expect when working with peaks and troughs. It uses Wealth-Lab's zigzag study to draw a zigzag based on 5% reversal on a closing price basis. This zigzag is drawn as a solid red and blue line. The script also shows you the most recent peak and trough levels, as they were known as of each bar. These levels are drawn as dots on the chart. Finally, the script calculates the lag between the actual peak/trough bar and the bar at which it was detected. The script prints these lag values on the chart. A sample chart is in Figure 3.

FIGURE 3: Wealth-Lab, ZIGZAG INDICATOR. Here is a sample chart of the zigzag validity in Wealth-Lab.
GO BACK{$I 'ZigZag Study'} var Bar, Lag: integer; ZigZag( 5 ); PlotSeries( PeakSeries( #Close, 5 ), 0, #Red, #Dots ); PlotSeries( TroughSeries( #Close, 5 ), 0, #Blue, #Dots ); for Bar := 1 to BarCount - 1 do begin if Peak( Bar, #Close, 5 ) <> Peak( Bar - 1, #Close, 5 ) then begin Lag := Bar - PeakBar( Bar, #Close, 5 ); AnnotateBar( 'Lag = ' + IntToStr( Lag ), PeakBar( Bar, #Close, 5 ), true, #Red, 8 ); end; if Trough( Bar, #Close, 5 ) <> Trough( Bar - 1, #Close, 5 ) then begin Lag := Bar - TroughBar( Bar, #Close, 5 ); AnnotateBar( 'Lag = ' + IntToStr( Lag ), TroughBar( Bar, #Close, 5 ), false, #Blue, 8 ); end; end;--Dion Kurczek, Wealth-Lab, Inc.
www.wealth-lab.com
![]() WEALTH-LAB: RSI SYSTEM
WEALTH-LAB: RSI SYSTEM
The Wealth-Lab code for Dennis Peterson's article in this issue, "Developing a Trading System," was already included in the article, but we wanted to explain one interesting aspect of the script. The trading system presented in the article is fairly complex, and consists of multiple entry and exit rules. In fact, the entry rule specifies that four different entry conditions must be true before a long position is established.
To help visualize the system rules, we utilized the advanced chart annotation capabilities of Wealth-Lab's scripting language. We assigned a number to each of the entry rules and the exit rules. We then used the AnnotateChart function to print on the chart the rule conditions that are met on a bar-by-bar basis. The individual buy rule numbers are printed below the bar. Once a position is established, the sell rule numbers are printed above the bar. A sample chart can be seen in Figure 4.

FIGURE 4: Wealth-Lab, TRADING SYSTEM DEVELOPMENT. In Wealth-Lab, you can examine the chart and quickly see the combination of rule conditions that are true at any bar.
In this way, you can examine the chart and quickly see the combination
of rule conditions that are true at any bar. This capability makes it far
easier to finetune the rules and be sure that they are expressing the market
dynamics you intend them to.
--Dion Kurczek, Wealth-Lab, Inc.GO BACK
www.wealth-lab.com
![]() NEUROSHELL TRADER: CENTER OF GRAVITY OSCILLATOR
NEUROSHELL TRADER: CENTER OF GRAVITY OSCILLATOR
John Ehlers's center of gravity oscillator from the May 2002 S&C can be easily implemented in NeuroShell Trader by using NeuroShell Trader's ability to call external program code, which can be written in C, C++, Power Basic, or Delphi. We've recreated the center of gravity oscillator in this way, and you can download it from NeuroShell Trader's free technical support website.
After downloading the custom indicator, you can insert it in a chart
by doing the following (Figure 5):
1. Select "New Indicator ..." from the Insert menu.
2. Select the Custom Indicator category.
3. Select the Center of Gravity indicator.
4. Select the parameters as you desire.
5. Select the Finished button.

Figure 5: NEUROSHELL TRADER, center of GRAVITY. Here's how to add the center of gravity oscillator using NeuroShell Trader's Indicator Wizard.A sample NeuroShell Trader chart of the center of gravity oscillator can be seen in Figure 6.

Figure 6: NEUROSHELL TRADER, center of GRAVITY CHART. Here's a sample NeuroShell Trader chart displaying the center of gravity oscillator.
You can also combine the custom indicator with any of our 800+ built-in
indicators into a chart, prediction, or trading strategy. In addition,
if you decide to use this indicator in a prediction or a trading strategy,
the coefficients can be optimized by the Genetic Algorithm built into NeuroShell
Trader Professional. This can provide you with your own custom version
of Ehlers's center of gravity oscillator that fits your data best.
Users of NeuroShell Trader can go to the STOCKS & COMMODITIES section of the NeuroShell Trader free technical support website to download a copy of this or past Traders' Tips.
--Marge Sherald, Ward Systems Group, Inc.GO BACK
301 662-7950, sales@wardsystems.com
www.neuroshell.com
![]() NEUROSHELL
TRADER: ZIGZAG VALIDITY
NEUROSHELL
TRADER: ZIGZAG VALIDITY
In "Zigzag Validity" in this issue, Spyros Raftopoulos describes a technique to help confirm a trend in progress using the zigzag indicator. This can be easily implemented in NeuroShell Trader by combining a few of the 800+ built-in indicators plus the zigzag indicator found in the Advanced Indicator Set (an extra-cost add-on).
To recreate the indicators, select "New Indicator ..."
from the Insert menu and use the Indicator Wizard to create each of the
following:
Z

 ZigZag(High, Low, percent)

last

 SelectiveMovingAverage (Lag(Z,1), OR2(AND2( A>B(Z,Lag(Z,1)),
  A<B(Lag(Z,1),Lag(Z,2) ), AND2( A<B(Z,Lag(Z,1)),
  A>B(Lag(Z,1),Lag(Z,2) ) ), 1 )

pc

 AbsoluteValue ( Divide ( Mutiply ( Subtract ( Close, last ), 100 ), last ) )

SD

 OR2 ( AND2 ( A>B(Z,Lag(Z,1), A>B(Lag(Z,1),Lag(Z,2)) ),

 AND2 ( A<B(Z,Lag(Z,1)),A<B(Lag(Z,1),Lag(Z,2)) ) )

res:

 A>=B(pc,percent)

ZigZagValidity

 IfThenElse( And2(Max(res,2),SD), 1, res )

ZigZagInvalid

 CrossBelow( ZigZagValidity, 0.5)

ZigZagUpTrendConfirmed

 CrossAbove ( AND2 ( A>B(Z, Lag(Z,1)), ZigZagValidity ), 0.5 )

ZigZagDownTrendConfirmed

 CrossAbove ( AND2 ( A<B(Z, Lag(Z,1)), ZigZagValidity ), 0.5 )
A sample chart can be seen in Figure 7.

Figure 7: NEUROSHELL TRADER, ZigZag VALIDITY INDICATOR. Here's a sample NeuroShell Trader chart showing the ZigZagValidity indicators.
Users of NeuroShell Trader can go to the STOCKS & COMMODITIES
section of the NeuroShell Trader free technical support website to download
a sample zigzag validity chart, which includes the custom indicators ZigZagValidity,
ZigZagInvalid, ZigZagUpTrendConfirmed, and ZigZagDownTrendConfirmed.
--Marge Sherald, Ward Systems Group, Inc.GO BACK
301 662-7950, sales@wardsystems.com
www.neuroshell.com
![]() NEUROSHELL
TRADER: RSI SYSTEM
NEUROSHELL
TRADER: RSI SYSTEM
To implement Dennis Peterson's stochastic RSI and Bollinger Band trading system in NeuroShell Trader, as described in his article "Developing A Trading System" elsewhere in this issue, you should first create the weighted price, Bollinger Bands, and stochastic RSI indicators in a chart and then create a NeuroShell Trading Strategy based on those indicators.
To create the weighted price, Bollinger Bands, and stochastic RSI, select
"New Indicator ..." from the Insert menu and use the
Indicator Wizard to create each of the following:
wprice:

Avg4( Close, Close, High, Low)

bbtop:

BollingerBandHigh( wprice, 14, 1.625 )

bbbottom:

BollingerBandLow( wprice, 14, 1.625)

StochRSI:

SimpleStochastic%K( RSI( Close, 14), 14)
To recreate the stochastic RSI and Bollinger Band trading system,
select "New Trading Strategy ..." from the Insert menu
and enter the following long and short entry conditions in the appropriate
locations of the Trading Strategy Wizard:
Generate a buy long MARKET order if ALL of the following are true:
A<B( Subtract( AbsoluteValue ( Divide( Sub ( wprice, bbbottom), Sub ( bbtop, bbbottom))), 0.9), 0.3)

A>B( Mult2 ( Close, 1.05 ), bbtop )

A>B( Volume, SelectiveLag( Volume, A>B( Close, Lag(Close,1)), 1 ))

A>B( StochRSI, 0.3 )

A>B( Divide( Subtract( Close, Open), Subtract( High, Low)), 0.2 )
Generate a trailing stop order at the following price:
Trailing Price Percent ( Trading Strategy, 5 )
Generate a sell short MARKET order if ALL of the following are true:
A<B( StochRSI, 0.7 )

A<B( AbsoluteValue ( Divide ( Subtract (wprice, bbtop), Subtract( bbtop , bbbottom))), 0.8 )

A>B( Close, Multiply ( 0.95, bbtop ))
A sample chart can be seen in Figure 8.

Figure 8: NEUROSHELL TRADER, STOCHASTIC RSI AND BOLLINGER BANDS. Here's a sample NeuroShell Trader chart for the stochastic RSI and Bollinger Band trading system.
If you have NeuroShell Trader Professional, you can also choose
whether the system parameters should be optimized. After backtesting the
trading strategy, use the "Detailed Analysis ..." button
to view the backtest and trade-by-trade statistics for the trading system.
Users of NeuroShell Trader can go to the STOCKS & COMMODITIES section of the NeuroShell Trader free technical support website to download a sample chart with the stochastic RSI and Bollinger Band trading system already built.
--Marge Sherald, Ward Systems Group, Inc.GO BACK
301 662-7950, sales@wardsystems.com
www.neuroshell.com
![]() NEOTICKER: CENTER OF GRAVITY OSCILLATOR
NEOTICKER: CENTER OF GRAVITY OSCILLATOR
To implement in NeoTicker the concept presented by John Ehlers in his article in the May 2002 S&C, "The Center Of Gravity Oscillator," we can start by creating an indicator called COG with two parameters (Listing 1).
The first parameter, Price, is a formula parameter, which accepts NeoTicker formulas in text format. The advantage of using formula type is that when users need to change the definition of Price, they will have to access the formula wizard to assist them. The second parameter Period is an integer. After setting up the indicator, enter the following code:
LISTING 1
function cog()

   dim i, j, Num, Denom

   dim price

   if not data1.valid (0) then

      itself.success = false

      exit function

   end if

   itself.makeindicator "price", "fml", Array("1"), Array(param1.str)

   price = itself.indicator ("price")

   Num   = 0

   Denom = 0

   i     = 0

   j     = 0

   while (i < param2.int) and (itself.currentbar (j) > param2.int)

     if price.valid (j) then

        Num   = Num + price.value (j) * (i +1)

        Denom = Denom + price.value (j)

        i = i + 1

     end if

     j = j +1

   wend

   if Denom <> 0 then

      cog = -1 * Num/Denom

   else

      itself.success = false

   end if

end function
On page 24 of the May 2002 S&C in Figure 1 of John Ehlers's
article, there is an additional signal line on the chart. There are two
ways to add this signal line to the chart: as an indicator on indicator,
or as a formula indicator.
To use the indicator-on-indicator method to add the signal line, start
by adding the center of gravity indicator to a chart, then click on the
legend at the upper left-hand corner to highlight the COG indicator. Right-click
on the legend and select "Add indicator" in the popup menu.
When the "Add indicator" window comes up, select simple moving
average and change the period value to 5. The resulting chart will have
two indicators: the COG indicator and a signal line, which is a smoothed
version of COG.

FIGURE 9: NEOTICKER, CENTER OF GRAVITY. Here's a sample NeoTicker chart of the center of gravity indicator with a signal line.
Alternatively, we can create a formula indicator called COGF (Listing
2) to plot both the COG and signal line. Start by setting up a new formula
indicator with three parameters. Parameters 1 and 2 are the same as the
ones in the center of gravity indicator. The third one is an integer parameter,
which is the smoothing period of the signal line. Figure 9 above shows
you the resulting indicator.
LISTING 2
plot1 := cog(data1, param1, param2);

plot2 := average(plot1, param3);
A downloadable version of these indicators will be available to
the public from the NeoTicker Yahoo user group website at https://groups.yahoo.com/group/neoticker/.
--Kenneth Yuen, TickQuest Inc.GO BACK
www.tickquest.com
![]() NEOTICKER: ZIGZAG VALIDITY
NEOTICKER: ZIGZAG VALIDITY
Spyros Raftopoulos presents the zigzag indicator in his article titled
"Zigzag Validity" in this issue. An indicator script named
"zigzag.pas" is available at the NeoTicker Yahoo user group
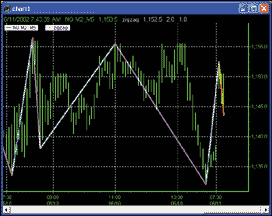
in the file area under the folder "sample_indicators." This
indicator can plot the zigzag lines in two distinct colors for up and down
moves, while for the nonconfirmed move at the latest data, it can paint
the tentative line using a separate color. In Figure 10, you can see that
the up moves are drawn in cyan and the down moves are drawn in magenta.
At the right edge, the nonconfirmed move that is just occurring is painted
in yellow.
GO BACK
FIGURE 10: NEOTICKER, zigzag indicator. Here's a sample NeoTicker chart of the zigzag indicator.
--Lawrence Chan
www.tickquest.com
![]() NEOTICKER: RSI SYSTEM
NEOTICKER: RSI SYSTEM
You can recreate the trading system presented in Dennis Peterson's article in this issue, "Developing a Trading System," in NeoTicker.
The system signal is based on two indicators. StochRsi is not a standard indicator in NeoTicker, so we have to create this indicator using formula language (Listing 1). To do so, first open a blank indicator; set the language as "formula"; and add two parameters, the first one being the number of periods to base the RSI on, and the second one being the stochastic period of the RSI.
We can develop the system using VBScript. Since NeoTicker is a state machine and is therefore unlike the code snip in the sidebar, no looping is needed. Also, for the last up bar volume, NeoTicker provides an object called "Heap," in which you can save the last up bar volume. See the code in Listing 2.
The stochrsi_sys added the ability to highlight the possible entry and exit points, as well as the ability to display the weighted prices and the Bollinger Bands. These plots can be optionally turned on/off by the user.
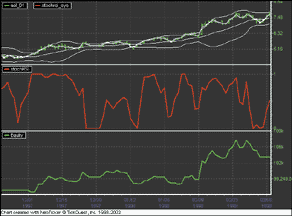
FIGURE 11: NEOTICKER, STOCHASTIC RSI TRADING SYSTEM. Here's a sample NeoTicker chart demonstrating Dennis Peterson's stochastic RSI trading system.
If you are interested in system-testing results, you can use the
built-in reporting facilities. You can also make changes to the system's
initial values, such as initial capital and commission calculation, to
adjust for different instruments on which the system is applied.
LISTING 1
plot1 := (RSIndex (data1, param1) - LLV(RSIndex(data1, param1), param2))/

         (HHV(RSIndex(data1, param1), param2) -

          LLV(RSIndex(data1,param1), param2));
LISTING 2
sub no_plot ()

   dim i

   for i = 1 to itself.plotcount

     itself.successex (i) = false

   next

end sub

function GetLastUpVol ()

    dim i

    for i = 1 to data1.barsnum (0)

       if data1.close (i) > data1.close (i+1) then

          GetLastUpVol = data1.volume (i)

          exit for

       end if

    next

end function

function LastEntryBar ()

dim c, i, j

  c = Trade.TransactionCount

  if c <= 0 then

     LastEntryBar = 0

     exit function

  end if

  j = -1

  for i = c-1 to 0 step -1

    if Trade.Transactions (i).TransType = ttLong then

      j = i

      exit for

    end if

  next

  if j >= 0 then

    LastEntryBar = Trade.Transactions (j).BarsNum

  end if

end function

function stochrsi_sys()

   Const StoreSize  = 2

   Const LastUpVol  = 0 'Last up bar volume location

   Const ExitBar123 = 1

   'adjustment calculation

   dim rdp1, rdp2, rdv1

   dim mystddev, mystddevvol

   dim adjust1, adjust2

   'Entry position calculation variables

   dim deviations, periods, BBpds

   dim howclosetoBBbot, longthresholdentry

   dim wprice, wbband3, srsi2

   'Exit position calculation variables

   dim howclosetoBBtop, longthresholdexit

   if not data1.valid (0) then

      no_plot

      exit function

   end if

   if Heap.size = 0 then

      Heap.allocate (StoreSize)

      Heap.fill 0, StoreSize-1, 0

   end if

   if Heap.Value(LastUpVol) = 0 then

      Heap.Value(LastUpVol) = GetLastUpVol

   end if

   itself.makeindicator "srsi1", "stochrsi", Array("1"), _

          Array (param2.str, param2.str)

   itself.makeindicator "mystddev", "stddev", Array("srsi1"), _

          Array (param1.str)

   mystddev = itself.indicator ("mystddev")

   itself.makeindicator "stddevvol", "fml", Array("1"), _

          Array("stddev(average(0, data1.v, " + param2.str + _

                ")/1000000,"  + param1.str + ")")

   mystddevvol = itself.indicator ("stddevvol")

   rdp1 = tq_round (mystddev.value (0)/0.053)

   rdp2 = tq_round (mystddev.value (0)/0.035)

   rdv1 = tq_round (mystddevvol.value (0))

   'adjustment calculation

   adjust1 = rdv1-rdp1+11

   if adjust1 < 8 then

      adjust1 = 8

   elseif adjust1 > 12 then

      adjust1 = 12

   end if

   adjust2 = rdv1-rdp2+14

   if adjust2 < 12 then

      adjust2 = 12

   elseif adjust2 > 20 then

      adjust2 = 20

   end if

   periods = tq_double2integer(adjust1)

   BBpds   = tq_double2integer(adjust2)

   howclosetoBBbot    = 0.9

   longthresholdentry = 0.3

   itself.makeindicator "wprice", "fml", Array("1"), Array("(2*c+h+l)/4")

   wprice = itself.indicator ("wprice")

   deviations = tq_double2integer(tq_round(0.0625*BBpds+0.75))

   itself.makeindicator "srsi2", "stochrsi", Array("1"), _

          Array (tq_integer2str(periods), tq_integer2str(periods))

   srsi2 = itself.indicator ("srsi2")

   itself.makeindicator "wbband3", "bbands3", Array("wprice"), _

          Array(tq_integer2str(BBpds), tq_integer2str(deviations))

   wbband3 = itself.indicator ("wbband3")

   'Entry Condition

   EntryCondition1 = 0

   EntryCondition2 = 0

   EntryCondition3 = 0

   EntryCondition4 = 0

   if (wbband3.ValueEx(1,0)-wbband3.ValueEx(3,0)) = 0 then

      EntryCondition1 = 0

   else

      botpercentage = tq_abs((wprice.value (0) - wbband3.ValueEx(3, 0))/ _

                            (wbband3.ValueEx(1, 0) - wbband3.ValueEx(3,0)))

     EntryCondition1 = (tq_abs(botpercentage-howclosetoBBbot)<0.3)

   end if

   EntryCondition2 = ((data1.close(0)*1.05 > wbband3.valueex(3, 0)) and _

                     (srsi2.value(0) > longthresholdentry))

   EntryCondition3 = ((data1.close(0) > data1.close(1)) and _

                     (Heap.Value(LastUpVol) > 0) and _

                     (data1.volume(0) > Heap.Value(LastUpVol)))

   if data1.close (0) > data1.close (1) then

      Heap.Value(LastUpVol) = data1.volume(0)

   end if

   if (data1.High(0)-data1.low(0)) = 0 then

      EntryCondition4 = 0

   else

      EntryCondition4 = tq_abs((data1.close(0)-data1.Open(0))/ _

                         (data1.High(0)-data1.Low(0)))>0.2

   end if

   'plot weighted price

   if wprice.valid (0) then

      itself.plot(6) = wprice.value (0)

   else

      itself.successex (6) = false

   end if

   'plot bband for weighted price

   if wbband3.validex (1, 0) and wbband3.validex (2,0) and _

      wbband3.validex (3,0) then

      itself.plot (7) = wbband3.valueex (1, 0)

      itself.plot (8) = wbband3.valueex (2, 0)

      itself.plot (9) = wbband3.valueex (3, 0)

   else

      itself.successex (7) = false

      itself.successex (8) = false

      itself.successex (9) = false

   end if

   if (EntryCondition1<>0) then

       itself.plot(2) = data1.close (0)

   else

       itself.successex (2) = false

   end if

   if (EntryCondition2<>0) then

       itself.plot(3) = data1.close (0)

   else

       itself.successex (3) = false

   end if

   if (EntryCondition3<>0) then

       itself.plot(4) = data1.close (0)

   else

       itself.successex (4) = false

   end if

   if (EntryCondition4<>0) then

       itself.plot(5) = data1.close (0)

   else

       itself.successex (5) = false

   end if

   if (EntryCondition1<>0) and (EntryCondition2<>0) and _

      (EntryCondition3<>0) and (EntryCondition4<>0) then

       itself.plot(10) = data1.close (0)

   else

       itself.successex (10) = false

   end if

   'Exit Conditions

   longthresholdexit = 0.7

   howclosetoBBtop   = 0.8

   ExitCondition1 = 0

   ExitCondition2 = 0

   ExitCondition3 = 0

   ExitCondition4 = 0

   ExitCondition5 = 0

   ExitCondition6 = 0

   ExitCondition7 = 0

   ExitCondition1 = srsi2.value(0) < longthresholdexit

   if (wbband3.ValueEx(1,0)-wbband3.ValueEx(3,0)) = 0 then

      ExitCondition2 = 0

   else

      toppercentage = tq_abs((wprice.value(0) - wbband3.ValueEx(1, 0))/ _

                            (wbband3.ValueEx(1, 0) - wbband3.ValueEx(3,0)))

      ExitCondition2 = (toppercentage < howclosetoBBtop)

   end if

   ExitCondition3 = data1.close(0)>(0.95*wbband3.Value(1, 0))

   ExitCondition4 = data1.close(0)<wbband3.value(3, 0)

   if (ExitCondition1<>0) and (ExitCondition2<>0) and _

      (ExitCondition3<>0) then

      Heap.Value (ExitBar123) = data1.BarsNum (0)

   end if

   ExitCondition5 = (Heap.Value(ExitBar123) > 0) and _

                    (data1.BarsNum(0) - Heap.Value(ExitBar123)) < 4

   ExitCondition6 = (data1.close(1)-data1.Open(1)) < 0

   ExitCondition7 = (LastEntryBar > 0) and _

                    (data1.BarsNum(0) - LastEntryBar) < 2

   if (ExitCondition1<>0) then

      itself.plot (11) = data1.close (0)

   else

      itself.successex (11) = false

   end if

   if (ExitCondition2<>0) then

      itself.plot (12) = data1.close (0)

   else

      itself.successex (12) = false

   end if

   if (ExitCondition3<>0) then

      itself.plot (13) = data1.close (0)

   else

      itself.successex (13) = false

   end if

   if (ExitCondition4<>0) then

      itself.plot (14) = data1.close (0)

   else

      itself.successex (14) = false

   end if

   if (ExitCondition5<>0) then

      itself.plot (15) = data1.close (0)

   else

      itself.successex (15) = false

   end if

   if (ExitCondition6<>0) then

      itself.plot (16) = data1.close (0)

   else

      itself.successex (16) = false

   end if

   if (ExitCondition7<>0) then

      itself.plot (17) = data1.close (0)

   else

      itself.successex (17) = false

   end if

   if (ExitCondition4<>0) and (ExitCondition5<>0) then

      itself.plot (18) = data1.close (0)

   else

      itself.successex (18) = false

   end if

   if (ExitCondition6<>0) and (ExitCondition7<>0) then

      itself.plot (19) = data1.close (0)

   else

      itself.successex (19) = false

   end if

   if (Trade.OpenPositionSize=0) and (EntryCondition1<>0) and _

      (EntryCondition2<>0) and (EntryCondition3<>0) and _

      (EntryCondition4<>0) then

      Trade.BuyAtMarket param3.int, "buy at market"

      heap.Value (ExitBar123) = 0

   end if

   if Trade.OpenPositionSize > 0 then

      if (ExitCondition5<>0) and (ExitCondition4<>0) then

         Trade.SellAtMarket param3.int, "Sell 4and5"

      elseif (ExitCondition6<>0) and (ExitCondition7<>0) then

         Trade.SellAtMarket param3.int, "Sell 6and7"

      end if

   end if

   itself.plot (1) = Trade.CurrentEquity

end function
A downloadable version of these indicators will be available from
the TickQuest website as well as from the NeoTicker Yahoo user group.
--Kenneth Yuen, TickQuest Inc.
www.tickquest.com
![]() AIQ: CENTER OF GRAVITY OSCILLATOR
AIQ: CENTER OF GRAVITY OSCILLATOR
Here is the EDS code for implementing the center of gravity oscillator, which John Ehlers introduced in the May 2002 issue of STOCKS & COMMODITIES. This code is intended for educational purposes only, and is provided as-is.
define Length 10.

price is ([high] + [low]) / 2.

count is OffsetToDate(Month(),Day(),Year()).

! Non-delayed Ehlers CG Formula

num is Sum(price * (count+1),Length).

denom is Sum(price,Length).

Ehlers is -num/denom.
!Since EDS does not store values in arrays the way EasyLanguage
does, you must create a separate formula
! for the "Delay" used as the signal line. Since the
Count UDF will always return the number of days in
!the sum from the report date, we simple fake it out by not adding
the "1" to count as we did above.
!This just zeroes out one day of the formula so we can get the "yesterday"
value of the real formula.
num1 is Sum(price * count,Length).

denom1 is Sum(price,Length).

Ehlers1 is -num1/denom1.
CG is Ehlers.
CG1 is ValResult(Ehlers1,1).
--AIQSystemsGO BACK
www.aiqsystems.com
![]() INVESTOR/RT: ZIGZAG VALIDITY
INVESTOR/RT: ZIGZAG VALIDITY
The zigzag indicator (ZIG) discussed by Spyros Raftopoulos in his article
in this issue is a built-in indicator in Investor/RT. The chart in Figure
12 depicts a 10% zigzag on a daily candlestick chart of Microsoft.
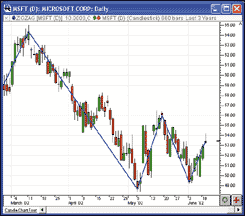
Figure 12: Investor/RT. ZIGZAG. This sample Investor/RT candlestick chart of Microsoft is overlaid with a 10% zigzag indicator.
The preferences for the zigzag indicator are shown in Figure 13.
The user has the option of choosing a specific price (open, close, high,
low, Ohlc/4, and so on) on which the zigzag will be constructed, or choosing
to "Use High/Low." If the "Use High/Low" option
is selected, Investor/RT will consider the extreme prices of each bar when
deciding whether the bar has reached the percent change validation threshold.
The user may also specify the percent change level and the color, style,
and thickness of the zigzag lines.
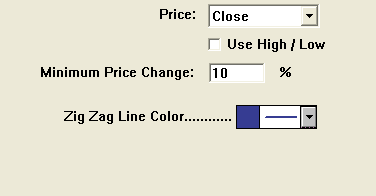
Figure 13: Investor/RT, ZIGZAG. Here are the suggested preference settings for the zigzag indicator.
The Investor/RT Rtl language has access to the zigzag indicator
using the token "Zig." In the language, Zig represents the
percent change level that the current level has achieved. By qualifying
the Zig token, the user can access the percent change level that was achieved
by previous legs of the zigzag indicator. For instance, Zig.1 would represent
the percent change level reached by the next-to-last leg, while Zig.2 would
represent the percent change level reached by the leg prior to that. Zig.1
and Zig.2 could never have a smaller magnitude than the "minimum
price change (%)" specified in the preferences, since these legs
have already been validated to the percent change level.
Zig, however, may not yet have reached its required threshold. The following scan would test the current leg for validation on a 10 % change zigzag:
ZIG >= 10 OR ZIG <= -10
The following scan will find those instruments that have just
recently been validated:
(ZIG > 10 AND ZIG < 10.5) OR (ZIG.1 > 10 AND ZIG.1 < 10.5 AND ZIG > 0.5)
The first part of this scan, ZIG > 10 AND ZIG < 10.5, finds any
instruments whose current leg is between the 10 and 10.5% levels. The second
part of the scan, ZIG.1 > 10 AND ZIG.1 < 10.5 AND ZIG > 0.5, finds instruments
whose current leg is actually a very small negative value, but whose recently
validated leg is between 10% and 10.5%.
--Chad Payne, Linn SoftwareGO BACK
800 546-6842, info@linnsoft.com
www.linnsoft.com
![]() INVESTOR/RT: RSI SYSTEM
INVESTOR/RT: RSI SYSTEM
The entry and exit rules discussed in "Developing A Trading System" can be replicated in Investor/RT using scans or trading signals. The RTL syntax required for each rule is shown under the appropriate rule below.
Entry rules
Look for prices tagging the lower Bollinger Band.
Assuming this rule requires that the Bollinger Band value remain between
the high and low of the bar for the two previous bars, the syntax follows:
Look for a closing price of an up day (close > open) that is above the lower band.BOLD.1 >= LO.1 AND BOLD.1 <= HI.1 AND BOLD.2 >= LO.2 AND BOLD.2 <= HI.2
Volume of this up day should be greater than the volume of the previous up day.CL > OP AND CL > BOLD
This expression will require the use of the Signal Statistics Indicator (Sstat). Sstat should be set up as "Price At Last Signal" with price being "Volume" and the signal being a scan with the syntax CL > OP. The syntax for this rule follows:
StochRsi should be above a threshold to ensure some momentum is associated with the pushup.VO > SSTAT.1
Assuming that our threshold level is 70, the syntax for this rule follows:
Use (close-open)/(high-low)>0.2 to avoid days that have short candlestick bodies.RAWK(RSI) > 70
(CL ? OP)/(HI ? LO) > 0.2
We can combine all these entry rules into one scan/signal with the
following syntax by ANDing them all together:
BOLD.1 >= LO.1 AND BOLD.1 <= HI.1 AND BOLD.2 >= LO.2 AND BOLD.2 <= HI.2
 AND CL > OP AND CL > BOLD AND VO > SSTAT.1 AND RAWK(RSI) > 70
 AND (CL ? OP)/(HI ? LO) > 0.2
Exit Rules
StochRsi should be less than a threshold to assure loss of momentum.
Assuming that our threshold level is 30, the syntax for this rule follows:
Look for prices to reach the upper band.RAWK(RSI) < 30
To look at all of the past three bars to see if any of them have exceeded the Bollinger Band, use the following syntax:
Closing price should be near the top Bollinger Band.HI >= BOLU OR HI.1 >= BOLU.1 OR HI.2 >= BOLU.3
Assuming that being near equates to being within 1%, use the following syntax:
We can combine all these exit rules into one scan/signal with the following syntax by ANDing them all together:ABS(CL ? BOLU) / BOLU <= 0.01
RAWK(RSI) < 30 AND (HI >= BOLU OR HI.1 >= BOLU.1 OR HI.2 >= BOLU.3)
 AND ABS(CL ? BOLU) / BOLU <= 0.01
Figure 14 shows an Investor/RT chart depicting all the components
used in the signals, along with the entry and exit signals themselves.
In the upper pane, the daily candlesticks of MSFT are overlaid with Bollinger
Bands as well as the entry (blue) and exit (red) signals. In the middle
pane, the StochRsi is charted in blue. In the lower pane, the daily volume
is shown.
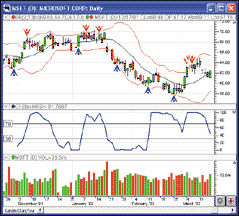
Figure 14: Investor/RT, STOCHASTIC RSI and BOLLINGER BAND TRADING SYSTEM. Here's a sample Investor/RT daily candlestick chart of Microsoft showing the entry and exit signals historically, along with the components on which the signals are based.
--Chad Payne, Linn SoftwareGO BACK
800 546-6842, info@linnsoft.com
www.linnsoft.com
![]() TRADINGSOLUTIONS:
RSI SYSTEM
TRADINGSOLUTIONS:
RSI SYSTEM
In his article "Developing A Trading System" in this issue, Dennis Peterson presents a trading system based on the stochastic RSI and Bollinger Bands. In addition to combining these two different approaches, the system also dynamically adjusts the width of the Bollinger Bands and the periods of the calculations as market conditions change. TradingSolutions can do this through the use of variable-length functions.
This complete system is available in a function file that can be downloaded from the TradingSolutions website (www.tradingsolutions.com) in the Solution Library section. Due to its length, only the key concepts will be covered here.
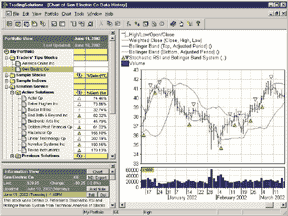
Figure 15: TradingSolutions, STOCHASTIC RSI AND BOLLINGER BAND TRADING SYSTEM. Here's a sample chart displaying stochastic RSI and Bollinger Band system entries and exits along with the adjusted Bollinger Bands and weighted close.
The stochastic RSI function is a stochastic oscillator of the RSI.
Two versions of this function are used: a static version and a variable-length
version. The static version is used to calculate the period used in the
variable-length version. The variable-length stochastic Rsi requires variable-length
stochastic and Rsi functions to be written. The difference between the
static versions and the variable-length versions is the same as it is here
-- the underlying functions are simply replaced with their variable-length
counterparts.
Stochastic RSI

Name: StochRSI

Inputs: Close, Period

Stoch (RSI (Close, Period), RSI (Close, Period), RSI (Close, Period), Period, 1)

Stochastic RSI (Variable Length)

Name: StochRSIVL

Inputs: Close, Period, Maximum Period

StochVL (RSIVL (Close, Period, Maximum Period), RSIVL (Close, Period, Maximum Period),
 RSIVL (Close, Period, Maximum Period), Period, Maximum Period, 1)
To ease the writing of the period calculation functions, a Restrict
function can be written to clip a value to a specified range.
Restrict Value Range

Name: Restrict

Inputs: Value, Lowest Value, Highest Value

If (LT (Value, Lowest Value), Lowest Value, If (GT (Value, Highest Value), Highest Value, Value))
The period for the variable-length stochastic RSI can then be calculated
from the variability of the static stochastic RSI as follows:
Stochastic RSI Period

Name: StochRSIPeriod

Inputs: Close, Volume, Initial Period, StDev Period

Restrict (Add (Sub (Round (StDev (Div (MA (Volume, Initial Period), 1000000),
 StDev Period)), Round (Div (StDev (StochRSI (Close, Initial Period), StDev Period),
 0.053))), 11), 8, 12)
This system also requires variable-length versions of the Bollinger
Band functions. Again, these are created by replacing the underlying functions
with their variable-length counterparts. For example:
One other supporting function of note is the calculation of the volume of the most recent up day. This is done in TradingSolutions by having a function get the current volume if it is an up day, or take the previous value of the function if it is not an up day.Bollinger Band (Bottom, Variable Length) Name: BBBotVL Inputs: Data, Period, Maximum Period, Deviations Sub (MAVL (Data, Period, Maximum Period), Mult (StDevVL (Data, Period, Maximum Period), Deviations))
By breaking down the system into its supporting calculations, each of the entry and exit rules for this function can be written. TradingSolutions users entering the functions by hand should note that the way the exit functions are combined is different for the Wealth-Lab code sample in the article than for the MetaStock code sample. The function file available online contains both versions.Volume Most Recent Up Day Name: VolumeUp Inputs: Close, Volume If (Inc (Close), Volume, Prev (1))
It is also worth noting that functions such as the stochastic RSI and Bollinger Band percentages may make good inputs to neural network predictions, especially in data where strong trends are present. When using them as an input to a prediction, you will typically want to set the preprocessing to "None," since they are already normalized to specific ranges.
--Gary Geniesse, NeuroDimension, Inc.GO BACK
800 634-3327, 352 377-5144
www.tradingsolutions.com
![]() TECHNIFILTER
PLUS: CENTER OF GRAVITY OSCILLATOR
TECHNIFILTER
PLUS: CENTER OF GRAVITY OSCILLATOR
Here is a TechniFilter Plus formula for the center of gravity oscillator (CG), which was discussed by John Ehlers in his article in the May 2002 S&C.
This multiline formula charts both the CG formula and the lagged CG formula that Ehlers used to generate his oscillator charts in the article. The {f} directive in line 2 caused TechniFilter Plus to compute the line day by day. This makes the quantity (CU13Y000 ? CU13 + 1) calculate properly to compute Ehlers's formula.
Formula for the Center of Gravity Oscillator

NAME: CG

SWITCHES: multiline

PARAMETERS: 10

FORMULA:

[1]: (H + L) / 2

[2]: ([1] * (CU13Y000 - CU13 + 1) )F&1 / [1]F&1  {f}

[3]: [2]    {NC}{C}{nCG}  {rgb#255}

[4]: [2]Y1   {C}{nCGY1}   {rgb#32768}
Visit RTR's website to download this formula as well as program
updates.
--Clay Burch, Rtr SoftwareGO BACK
919 510-0608, rtrsoft@aol.com
www.rtrsoftware.com
![]() SMARTRADER:
CENTER OF GRAVITY OSCILLATOR
SMARTRADER:
CENTER OF GRAVITY OSCILLATOR
Recreating the center of gravity oscillator presented by John Ehlers in the May 2002 S&C requires building four formulas in SmarTrader. Although two of them are lengthy, they are all simple and straightforward.
The SmarTrader specsheet for the center of gravity oscillator is given
in Figure 16. First, in row 9, we compute the midpoint of the daily High/Low
price range. We shortened the name in the article to Pr for brevity
in subsequent formulas.
Next, in row 10, we compute Num, the numerator in the CG formula. This
is a numerically weighted sum of the last 10 Close prices. Row 11, Denom,
is the unweighted sum of the same 10 prices.
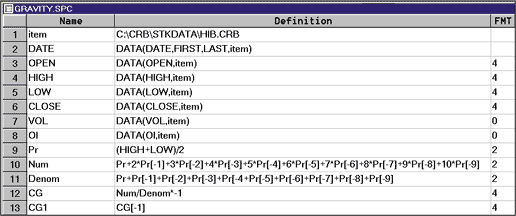
Figure 16: SMARTRADER SPECSHEET, CENTER OF GRAVITY. Here is the specsheet for implementing John Ehlers's center of gravity oscillator.
Row 12 computes the CG by dividing Num by Denom and multiplying
by -1 to invert the plot. Row 13, CG1, is the value of CG shifted by one
period (bar).
Figure 17 shows a sample SmarTrader chart of the center of gravity oscillator.
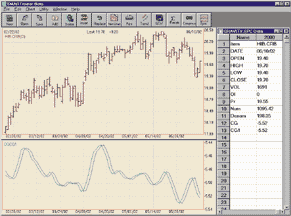
Figure 17: SMARTRADER, CENTER OF GRAVITY. Here is a sample chart of John Ehlers's center of gravity oscillator.
For this article, it is important to note that since SmarTrader
can make references both backward and forward, all references to previous
(earlier) bars must include a minus sign. For CompuTrac Snap users, omit
the minus sign.
--Jim Ritter, Stratagem Software
504 885-7353, Stratagem1@aol.com
![]() WAVE
WI$E MARKET SPREADSHEET: CENTER OF GRAVITY OSCILLATOR
WAVE
WI$E MARKET SPREADSHEET: CENTER OF GRAVITY OSCILLATOR
The following Wave Wi$e formulas calculate and chart John Ehlers's
center of gravity. A sample chart is shown in Figure 18.
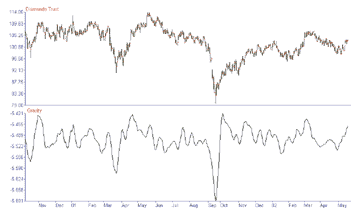
Figure 18: Wave Wi$e, CENTER OF GRAVITY. Here's a sample Wave Wi$e chart demonstrating John Ehlers's center of gravity oscillator.
A: DATE     @TC2000(C:\TC2000V3\Data,DIA,Diamonds Trust,DB)

 B: HIGH

 C: LOW

 D: CLOSE

 E: OPEN

 F: VOL

 G: Price     (HIGH+LOW)/2

 H: Gravity   PROCEDURE(GRAVITY)

 I:   chart  @CHART(1)

 J:             ' ==========End Formulas

' PROCEDURE GRAVITY

'COMPUTE CENTER OF GRAVITY

#NAME PERIOD 10

X$1=0 : X$2=0

@FOR Y$1 = 0 TO PERIOD-1

 X$1=X$1 + PRICE[-Y$1]*(Y$1+1) 'NUMERATOR

 X$2=X$2 + PRICE[-Y$1]  'DENOMINATOR

NEXT

@IF X$2 <> 0 THEN

 X$3=-X$1/X$2

ELSE X$3=0

ENDIF

@RETURN(X$3)

' END PROCEDURE GRAVITY
--Peter Di Girolamo, Jerome Technology
908 369-7503, jtiware@aol.com
https://members.aol.com/jtiware
![]() WAVE
WI$E MARKET SPREADSHEET: ZIGZAG VALIDITY
WAVE
WI$E MARKET SPREADSHEET: ZIGZAG VALIDITY
The following Wave Wi$e formulas calculate zigzag or pivot points. As noted by author Spyros Raftopoulos in his article in this issue, these calculations show historical trends and may not be used in systems, since the ongoing pivot is modified as new data is added.
 A: DATE @TC2000(C:\TC2000V3\Data,DJ-30,Dow Jones Industrials,DB)

 B: HIGH

 C: LOW

 D: CLOSE

 E: OPEN

 F: VOL

 G: proc      PROCEDURE(PIVCALC)

 H: Pivots

 I: PivotID

J: chart    @CHART(1)

 K:          ' ==========End Formulas

' PROCEDURE PIVCALC

'DETERMINE  HIGH AND LOW PIVOTS

'========================================

#NAME PERIOD X$5

#NAME ROWLO X$1

#NAME ROWHI X$2

#NAME PVLOW X$3

#NAME PVHIGH X$4

PERIOD=@INPUT(ENTER THE PERIOD OF PIVOT,7,1)

@IF @ROW() = 1 THEN 'INITIALIZE

 ROWLO=1 'ROW OF LAST LOW

 ROWHI=1 'ROW OF LAST HIGH

ENDIF

@CELLPUT(@COLUMN()+1,@ROW(),@BLANK()) 'CLEAR PREVIOUS VALUES

@CELLPUT(@COLUMN()+2,@ROW(),0) 'CLEAR PREVIOUS VALUES

@IF LOW < @MIN(LOW[-1],PERIOD) THEN 'TEST FOR NEW HIGH

 PVHIGH=@MAX(HIGH,@ROW()-ROWLO)

 ROWHI=@ROWOF(@MAX(HIGH,@ROW()-ROWLO))

 @CELLPUT(@COLUMN()+1,ROWHI,PVHIGH)

 @CELLPUT(@COLUMN()+2,ROWHI,1) 'SAVE HIGH ID

 @RETURN(1) 'SHOW WE FOUND HIGH

ENDIF

@IF HIGH > @MAX(HIGH[-1],PERIOD) THEN 'TEST FOR NEW LOW

 PVLOW=@MIN(LOW,@ROW()-ROWHI)

 ROWLO=@ROWOF(@MIN(LOW,@ROW()-ROWHI))

 @CELLPUT(@COLUMN()+1,ROWLO,PVLOW)

 @CELLPUT(@COLUMN()+2,ROWLO,-1) 'SAVE IOW ID

 @RETURN(-1) 'SHOW WE FOUND LOW

ENDIF

RETURN(0) 'SHOW WE FOUND NEITHER

' END PROCEDURE PIVCALC
--Peter Di Girolamo, Jerome TechnologyGO BACK
908 369-7503, jtiware@aol.com
https://members.aol.com/jtiware
![]() WAVE WI$E MARKET SPREADSHEET: RSI SYSTEM
WAVE WI$E MARKET SPREADSHEET: RSI SYSTEM
The following Wave Wi$e formulas and chart (Figure 20) demonstrate how to calculate RSI and stochastic RSI. We have added Bollinger Bands to both the price and RSI charts.
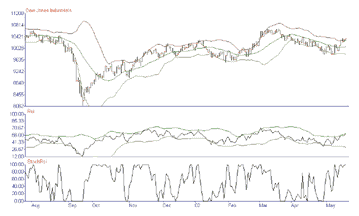
Figure 20: Wave Wi$e, rsi and bollinger band. Here's a sample Wave Wi$e chart demonstrating the stochastic RSI and Bollinger Bands indicators.
GO BACKA: DATE @TC2000(C:\TC2000V3\Data,DJ-30,Dow Jones Industrials,DB) B: HIGH C: LOW D: CLOSE E: OPEN F: VOL G: Avg21 @MAVG(CLOSE,21) H: UpBand AVG21 + 2 * @STD(B, 21) I: LoBand AVG21 - 2 * @STD(B, 21) J: Rsi @RSI(CLOSE,14) K: Rsi_Hi @MAVG(RSI,21) + 2 * @STD(RSI, 21) L: Rsi_lo @MAVG(RSI,21) - 2 * @STD(RSI, 21) M: StochRsi @STOCH(RSI, RSI, RSI, 14) N: 'End Formulas
--Peter Di Girolamo, Jerome Technology
908 369-7503, jtiware@aol.com
https://members.aol.com/jtiware
All rights reserved. © Copyright 2002, Technical Analysis, Inc.
Return to August 2002 Contents
