TRADING TECHNIQUES
Average True Range To Measure Volatility?
Which Volatility Measure?
by Gordon Gustafson
Is it true? Is average true range, an approximation, superior to standard deviation, the most beloved of quants, as a measure of volatility?
Many traders use some measure of volatility to generate signals in their trading. For instance, one common entry technique is to buy when the price breaks outside a certain range of the volatility of the recent price action, either to the upside for trend following or below for countertrend systems. Another common use for volatility is in the construction of trailing stops;. An exit signal might be generated when the price falls below a recent low minus a measure of volatility.
In both cases, the rationale is that the price action has moved to such an extent that something is happening in the underlying instrument for reasons other than mere chance. But how, then, should the trader measure volatility?
Ideally, the indicator used should include within its range all price action that is the result of normal trading, so if the price moves outside the measure, we would know there is a reason to buy into or sell out of a position. While this might seem obvious, there are several factors to be considered here. For instance, is a volatility indicator good simply because it captures most of the price action? How can we tell which excursions are significant? Are all volatility measures created equal?
COMMON MEASURES
To answer these questions, I looked at the two most common measures of volatility used in system construction: the standard deviation; (STDEV) and the average true range (ATR);. In my experience, these measures are often used interchangeably in the generation of buy signals, though in nearly all trailing stops I've seen, the ATR is the indicator of choice (for example, set stop at close - 2x the ATR). True range is the greatest of:
1 The distance from today's high to today's low
2 The distance from yesterday's close to today's high, or
3 The distance from yesterday's close to today's low.
Average true range is the average of a number of periods of true range.
These indicators are constructed very differently and aren't really interchangeable. The common perception is that the ATR is a better measure of volatility because it captures more information, while the STDEV only measures the volatility of the closes (in its most common usage). STDEV can be applied to the highs, lows, or any series that the trader likes. In this sense, STDEV is the more flexible of the two.

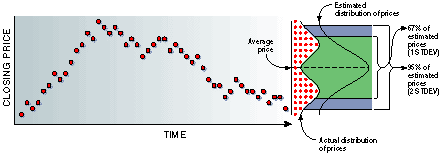
FIGURE 1: STANDARD DEVIATION. The STDEV is a statistical measure that identifies volatility in a price series. The mathematics behind STDEV estimates that two standard deviations plus or minus from the base series should contain 95% of the observed data.
The STDEV is a statistical measure that identifies volatility in a price series. The mathematics behind STDEV estimates that two standard deviations plus or minus from the base series should contain 95% of the observed data. (See Figure 1.)
The ATR is often more frequently used because it measures the total range of the series by comparing highs and lows as well as closes, and also by comparing the price fluctuation over different days to account for gaps up and down in price. There is no mathematical proof behind the ATR, but many traders feel it captures more relevant data for them to make decisions.
Gordon Gustafson is a private trader. He can be reached at gustg@earthlink.net.
Excerpted from an article originally published in the June 2001issue of Technical Analysis of STOCKS &COMMODITIES magazine. All rights reserved. copy; Copyright 2001, Technical Analysis, Inc.
Return to June 2001 Contents