NEW TECHNIQUES
Adaptive Filtering Improves Trading System Results
Tweaking The T3 Trading System
by Steve Burns
Have you ever wished that your filter-based trading system adapted to shifts and nuances in data trends? You might want to take a look at this.
Conventional averaging or filter-based trading systems have no provisions for adapting to data trend dynamics. Their fitting constants - the parameters in their formulas - are predetermined and remain constant for all data. Analysts routinely overfit these systems to past data, with resulting disappointment when the systems are used.
An alternative to the nonadaptive filter/overfitting dilemma is to incorporate dynamics into trading system-fitting parameters. An intelligent adaptive filter is one that learns from the data and adjusts parameter values.
I use an adaptive filter based on a least-squares regression fitting. The r-squared of the regression ranges from zero to 1, with zero being no success and 1 being perfect success. R-squared works well as an adaptive fitting parameter because its value is determined by the trending data. Here's how I used it.
T3 NONADAPTIVE FILTER
I started with T3, an interesting nonadaptive filter by Tim Tillson, from an article he wrote for STOCKS & COMMODITIES. See sidebar "Tillson's T3" on page 32, for the computation of T3.
T3 is an excellent data-fitting technique. T3 parameters t and r are
T3's period and sensitivity, respectively. Parameter t- and r-values less
than six generally make T3 system tests fast, a characteristic I think
of as favorable. (Tillson's article uses the notation "periods"
and a instead of t and r.) (See sidebar "Fast? Slow?" on page
36.) Figure 1 shows a MetaStock 6.5 chart of Aristotle, the closing price
of which is fitted with T3.
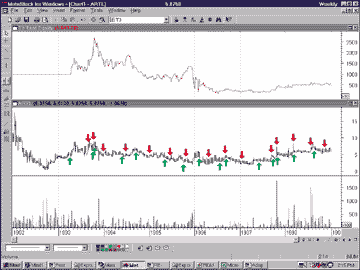
FIGURE 1: A nonadaptive T3 system test applied to Aristotle fails to achieve exponential equity growth. OptiumROI equity is with the T3 period and sensitivity equal to 12 and 2, respectively.
Long positions (up arrows) were taken when the closing price fell below the T3 level. Short positions (down arrows) were taken when the closing price was greater than T3. The upper plot is the system test's equity. An investment of $1,000 in 1992 stayed almost even to the end of 1998. For later comparison, I've included in Figure 2 the MetaStock report for Figure 1.
Steve Burns works for Maxtor Corp. as a design engineer. He can be reached at zeromass@earthlink.com
Excerpted from an article originally published in the June 2001issue of Technical Analysis of STOCKS & COMMODITIES magazine. All rights reserved. © Copyright 2001, Technical Analysis, Inc.
Return to June 2001 Contents