VISUAL INSTRUCTION
A Venerable Charting Technique Is Explained In Picture Format
Trading Andrews Lines
by John W. Chandler
If you've ever wanted to know how to use the Andrews pitchfork technique, movement to movement, this should help you.
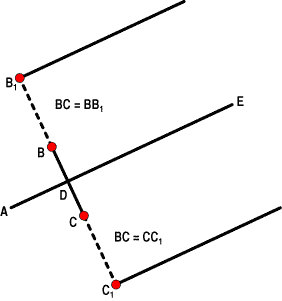
About 20 years ago, I first learned about the work of Alan Andrews and his pitchfork charting technique. The concept seemed fairly straightforward; you start with a sequence of three turning points identified as the most significant highs and lows of the time frame you are working in. This can be either a high (A), low (B), high (C), or a low (A), high (B), low (C). (See Figure 1.) Next, you draw a line between the last two turning points (B and C), find the midpoint of that line (D) and draw a line from A, through D, and extend it to the right as far as needed (E).

FIGURE 1: PITCHFORK CONSTRUCTION. From low A, draw a line through the midpoint of BC, extending it to E.
Then, extend the BC line both up and down by a distance equal to B-C in
each direction, the endpoints of which I can label as B1 and C1. Now, draw
lines from B1 and C1 to the right and each parallel to the ADE line. This
forms a type of angled pitchfork set of lines where the lines from B1,
D, and C1 are all parallel to each other. Additional parallel lines of
B2 and C2 and so forth can be added, but I've never bothered with the extensions
of even B1 and C1.
As I understood it, Andrews' basic tenet was that prices would tend to move out from C along either the C parallel line or between the "prongs" of the pitchfork -- that is, between the C line and the D line. That way, you would be able to determine how prices would move.
That's all I heard about Alan Andrews. The idea intrigued me, though, and I eventually set out to understand and expand upon the concept. I hope this will help you understand the ways the markets move.
In a wonderfully simple universe, the reaction from point C should come back toward line ADE and touch it at a point roughly equal in distance from D as is A. If I mark this as intersection point E, then in a perfectly symmetrical situation, the distance from D to E would be equal to the distance from D to A.
You simply continue the process as the market action unfolds and confirms new turning points. In the example in Figure 2, you would find the midpoint between C and E, mark it as F, and then draw a line from B through F and extend it to the right by a distance equal to B-F. I would label the end as point G. This new point G now becomes my next ideal target in both price and time.
You'll be surprised at how often this technique can actually identify a point in both time and price, when the market has a high probability of turning. When it doesn't behave in this perfectly symmetrical fashion, things become intriguing. With careful study, the market action around this first principle will begin to hint at what it's going to do next.
John Chandler works for US Bank. He can be reached at chanco@visi.com.
Excerpted from an article originally published in the December 2000 issue of Technical Analysis of STOCKS & COMMODITIES magazine. All rights reserved. © Copyright 2000, Technical Analysis, Inc.
Return to December 2000 Contents