NEW TECHNIQUES
Pseudo Securities For Technical Analysts
Part 3
by Charles E. Miller
The first two parts of this three-part series examined the theory, generation technique, and time series application of rectilinear pseudo securities. In this, the conclusion, the same theory is applied to the frequency domain of the market using sinusoidal pseudo securities to produce a method for their construction. Whereas the time domain was used to investigate the linear relationships between market data and time, the frequency domain will enable us to identify and study cyclical, nonlinear relationships in security price movement.
Trendlines are used individually to represent the general trend of a market and used plurally in the form of channels to define price extremes. However, real market data seldom is a true linear function of time. Just as nature abhors a vacuum, human nature seems to abhor stability, leading to asymmetry and disorder. Therefore, even though price fluctuations tend to resemble a study in Brownian motion without easily discernible symmetry and order, price is commonly represented by linear regression, support and resistance lines, channels, and other straight-line constructs. These are useful in suggesting future price action for limited periods only, typically because most moves represented as straight lines are actually components of longer, nonlinear cyclical moves.

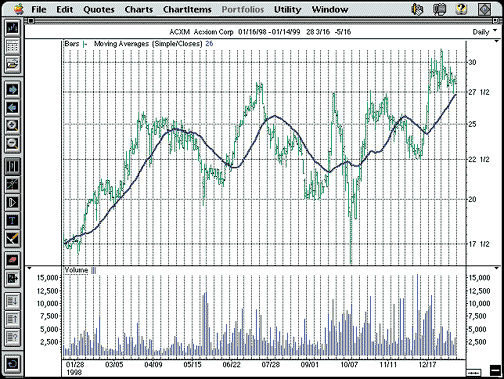
FIGURE 1: CYCLIC PRICE PATTERN. Cyclical patterns can be found with regularity in the price charts, as seen here for ACXM.
By close inspection of price fluctuations, we can often identify cyclical forces at work, resulting from two or more opposite groups, buyers and sellers. For many reasons, the relative sizes and characteristics of each of these groups change over time, producing a cyclical ebb and flow between buying and selling pressure. A highly dynamic process, this influence on a securityÕs price may vary dramatically in duration and severity. The duration of these influences can span from minutes to years.
These cyclical forces are represented in price vs. time charts, like the one seen in Figure 1 for Acxiom [ACXM], shown with its 26-day simple moving average. Those who are able to identify prior cyclical relationships in these charts and anticipate future movements can trade profitably on the resulting swings that buyers and sellers create. It is important that we be able to identify the presence and significance of these cyclic forces, and just as important, the frequency with which they occur. Many of the popular indicators supplied in technical analysis applications are used in this regard. But how confident are we with our interpretation of these indicators when applied to volatile markets?
Some indicators, such as the 200-day moving average or Bollinger bands, react nonlinearly to price, unlike trendlines and channels. This lack of rigidity is more responsive to market cycles having different periodicities. Entire analytical systems such as Elliott wave have been developed to improve trading results by taking advantage of the characteristics and consequences of price cyclicity, market inertia, and volatility. The intimate relationship between these three characteristics is the cause and effect of trading, and without them, prices would remain static, easily determined values. Buying stock would be like buying a certificate of deposit at a bank.
Charles E. Miller, who may be reached via E-mail at cemcemcem@aol.com, is an electrical engineer by training and a private investor. After 12 years as a development engineer at General Radio Co. (now GenRad), he joined the electrical engineering department at the Massachusetts Institute of Technology (MIT). He is now retired from 24 years of teaching at the Stroboscopic Light Laboratory at MIT. He continues to consult in a variety of fields, particularly high-speed and ultra high-speed imaging through his company, Northpoint Labs. The author would like to thank Jeffrey Bizon of BeeSoft, Inc. (www.BeeSoft.net), and John Slauson of Equis International (www.equis.com) for their generous support.
Excerpted from an article originally published in the August 1999 issue of Technical Analysis of STOCKS & COMMODITIES magazine. All rights reserved. © Copyright 1999, Technical Analysis, Inc.
Return to August 1999 Contents