NOVICE TRADER
Value At Risk And Technical Analysis
by Luis Ballescá-Loyo
This method uses market volatility and the concept of value at risk to help determine meaningful stop-loss prices and position limits for trading securities.
Many traders and investors apply security analysis techniques, either technical or fundamental, to take positions using mechanical buy and sell signals generated by their systems. In developing their systems, time is spent on developing the entry signals and, to a lesser extent, the exit signals. But as a rule, not as much time is spent reviewing the expected adverse moves typical of that system and market. Few traders fully consider the risk side of their trades beyond using stop orders to set limits on the losing side of their trades.

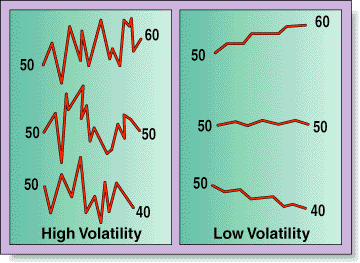
FIGURE 1: VOLATILITY. As you can see, even though the starting and ending prices of the moves are the same, the volatilities are different due to the fluctuations between two points.
Consider, then, a technical trader with a buy signal on a stock currently trading at $50 per share. How might he set his stop-loss protection? That would depend on how much he is willing to risk. Let's say our trader has $100,000 to trade and is buying 2,000 shares; further, let's say his investment horizon is one week and he is willing to lose $4,000 on this trade (4%). This would correspond to a sell-stop order at $48 a share (without commissions). Is this really the best method to use in effective risk management? This method of setting stop-loss protection considers only the traderÕs own risk aversion and not the typical price fluctuations of the underlying security.
PRICE VOLATILITY
According to modern portfolio theory -- which is usually applied to find efficient portfolios -- a trader can use the concept of stock volatility to set more effective stops by considering not only his own risk aversion but also the risk of the underlying stock.
Consider a stock initially trading at $50, moving to $60 in one week. Would you say it was a volatile stock? The correct answer is that we do not know! Volatility does not refer to price direction but to price changes, as can be seen in Figure 1. This illustrates the important attributes of price volatility. As you can see, even though the starting and ending prices of the moves are the same, the volatilities are different due to the fluctuations between these two points.
Luis Ballescá-Loyo is founder and chairman of IMERVAL, a leading financial training institute based in Mexico City since 1988. An active stocks and derivatives trader, he also runs a broker-firm member of the newly formed Mexican Derivatives Market (MexDer) and Global Derivatives, SC, a consulting firm on the use of derivatives for investment strategies and hedging risks. He may be reached via E-mail at imerval@infosel.net.mx or at https://nueve.com.mx/globalderivatives.
Excerpted from an article originally published in the August 1999 issue of Technical Analysis of STOCKS & COMMODITIES magazine. All rights reserved. © Copyright 1999, Technical Analysis, Inc.
Return to August 1999 Contents