This month, we begin a new section called Websites For Traders, describing Websites of possible interest to traders, technical analysts, and investors. Since this magazine's focus is technical analysis, we'll begin by discussing some Websites that offer charting.
ASK RESEARCH
www.askresearch.comAsk Research is a free service providing historical and real-time market data and charts. Select daily or intraday charts, and select your preferred settings for charts and indicator parameters. Indicators include on-balance volume (OBV), stochastics, Williams' %R, relative strength index, moving average convergence/divergence (MACD), and price rate of change. Plot exponential moving averages (EMAs) and Bollinger bands, on a linear or logarithmic price scale. The portfolio area with price quotes comes from Data Broadcasting. The News & Commentary button links to CBS MarketWatch.
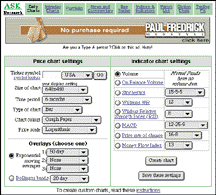
Ask Research's Day Trader area shows you live prices in five-minute bars for six indices: the Nasdaq, SPX, OEX, IT.TIX, XAU, and XOI. The charts refresh every 90 seconds and include EMA, OBV, stochastics, and money flow index. In another area, a Watch List allows you to keep an eye on up to six groups of 10 ticker symbols with quotes and technical charts, all in one convenient box. You can change the symbols included in the groups in case the defaults don't suit you. The price quotes in the Watch Lists come from World Wide Quote and North American Quotation.Ask Research chart setup
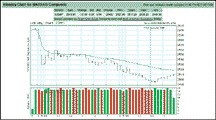
Ask Research intraday Nasdaq chart
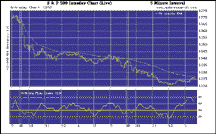
Ask Research live S&P chart
Finally, you can get a list of option chains by inputting a symbol, or you can simply choose to view the option market summary provided daily, which gives you the percentage gainers and losers in options as well as volume leaders at a glance.
BIGCHARTS
www.bigcharts.comBigCharts offers free, easy-to-use online charting and provides quick, reliable charts in time frames of one day (five-minute intraday bars) to 10 years. You have access to quotes, interactive charts, reports, and indicators on more than 50,000 stocks, mutual funds, and market indices.
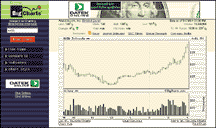
BigCharts interactive chart
You can choose to plot a quick chart or an interactive chart. Interactive charts give technical analysts many of the features they want, including user-adjustable simple moving averages, exponential moving averages and multiple moving averages, indicator studies such as stochastics, RSI, Bollinger bands, MACD, price channels, money flow, OBV, volume by price charts, and performance comparison charts. You can also change the type of chart, such as from close-only to candlesticks. You can even save the charts of your favorite stocks. The site includes access to fundamental statistics and recent corporate earnings announcements as well.
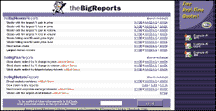
BigCharts BigReports
End-of-day data is provided by Interactive Data Corp. and intraday data is provided by S&P ComStock. BigCharts has a sophisticated search engine for searching by company name; industry; fund name or fund company name; index; and exchange. The "BigReports" list the movers and shakers in the market from the day before. Optional E-mail services offer custom charts on a daily or weekly basis.
EQUIS INTERNATIONAL
www.equis.com/java/From the home page of Equis International, maker of the popular technical analysis and charting software MetaStock, you'll find a free interactive charting and quote area. Stock, mutual fund, and index charts are offered in intraday, daily, weekly and monthly time frames, with intraday data delayed at least 20 minutes. Users also have the ability to add one or more of the 14 technical indicators available, and charts can be changed from high/low/close to include open, or changed to candlestick or line type. The cursor is "live," so when you pass it over a chart, the values displayed are automatically updated according to the cursorÕs position on the chart. Trendlines can be drawn simply by left-clicking and dragging between two points.
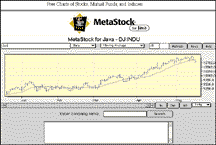
MetaStock Java chart (Equis International)
In a useful feature, you make up custom indices by combining securities you want in that index. In another flexible capability, you can show up to five securities at one time on a chart.
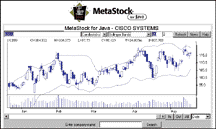
MetaStock candlestick chart (Equis Int'l)
Elsewhere at its Website, Equis offers a free downloader that can collect data compatible with many software programs, including its own MetaStock. Equis also uses MetaStock to monitor the stock market and provides lists of stocks meeting technical criteria. For users interested in knowing more about technical analysis you can read Steve Achelis' book, Technical Analysis From A To Z, online.
Originally published in the July 1999 issue of Technical Analysis of STOCKS & COMMODITIES magazine. All rights reserved. © Copyright 1999, Technical Analysis,Inc.