NEW TECHNIQUES
Yield Spread Tunnels
by Lorne W. Rae
Fixed-income investors have an array of instruments in which to invest. They can choose from an assortment of maturities as well as credit quality. Here's a simple technique with which to identify opportunities in the fixed-income market.
One common technique for assisting fixed-income investors and traders in their decision-making is the analysis of yield spreads. A yield spread is the difference in yield to maturity (or that discount rate which equates the present value of a bond to its market value) between two bonds. The spread is expressed in terms of basis points (each 1/100 of 1%), and yield spreads occur because bonds vary in maturity, in coupon, in marketability, and in quality.

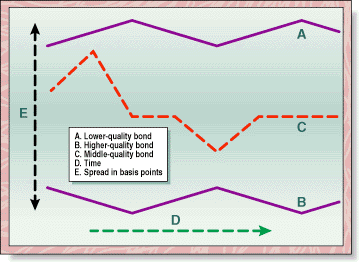
FIGURE 1: YIELD SPREAD TUNNEL. As the key indicates, the three lines represent the yield spreads of three bonds of similar maturity but differing quality. The top solid line represents the spreads over time of a lower-quality bond; the broken middle line represents the spread pattern of a midgrade bond; and the lower solid line represents a bellwether bond from which the other two spreads are calculated.However, traditional yield spread analysis is limited by its focus on just bond pairs. In the real world, an investor or trader must choose amid an overwhelming assortment of different bonds. What he or she needs is a simple and easy-to-use technique for multibond analysis to identify potential buys and sells. The yield spread tunnel (YST) and its trading rules meet that need.
THE TUNNEL CONCEPT
What is the yield spread tunnel (YST)? To visualize the YST concept, imagine the route taken by a speeding taxi weaving through traffic down a street or through a tunnel. Then imagine looking down on a tunnel like the one in Figure 1. The tunnel's walls are of width E and represented by two horizontal solid lines (A and B). Imagine, also, that the route of the taxi through the tunnel is the wavy broken line C running left to right in direction D. Now tilt the diagram's orientation toward you by 45 degrees so it represents a cross-sectional view with the walls defining a top and a bottom. Use the key to Figure 1 to label this reoriented diagram.
The new labeling transforms the physical tunnel concept into a graph of a financial market. As the key indicates, the three lines now represent the yield spreads of three bonds of similar maturity, but of differing quality. The top solid line represents the spreads over time of a lower-quality bond, the broken middle line the spread pattern of a midgrade bond, and the lower solid line a bellwether bond from which the other two spreads are calculated.
DEVELOPING THE TRADING SYSTEM
But the yield spreads are plotted unconventionally. They are not plotted as so many basis points off a bellwether, the traditional way. Instead, they are plotted above and below an imaginary zero line that bisects the diagram. For example, if the spread between the lowest-quality bond and the highest-quality bond is 80 basis points, the plot becomes +40 for the low-quality bond and -40 for the bellwether. By joining these plots over time by a line, the image of a symmetrical tunnel emerges.
Over time, the width of the tunnel alternatively widens and narrows to resemble a string of beads. All middle-quality bond spreads are plotted up from the bellwether in the traditional way. So in the 80-basis-point example, a middle-quality bond with a 30-basis-point spread over the bellwether bond would be plotted at -10 (-40 + 30 = -10). Middle-quality bonds will fluctuate within the bounds of the tunnel -- normally close to the zero line, but sometimes close to either the upper or lower tunnel walls. Figure 2 sets out the formulas for plotting each of the YST lines.