NEW TECHNIQUES
Pseudo Securities For Technical Analysts
by Charles E. Miller
As you develop your analytical skills, you probably pick a favorite market to study. So depending on the market, you could come to different conclusions about the value of different techniques of analysis. With that in mind, what if you used artificial data with distinct properties as a basis for learning the attributes of technical methods? In this, the first of a three-part series, we explore the notion of using pseudo securities.
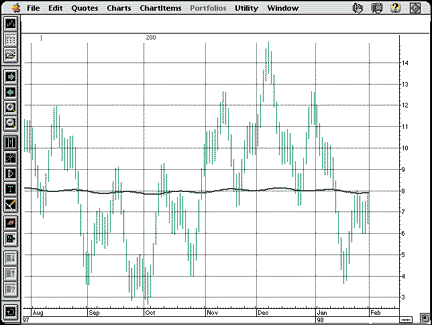
The objective of technical analysis is to locate securities with the necessary volatility to make potentially profitable round turns, and to predict, based on available historical data, suitable entry and exit points. Although the chart of the fictitious Omniscient, Inc. [OICT], shown in Figure 1 suggests it is a reasonable candidate, each technician will have his or her own approach to predicting price movements. Support lines, channels, indicators -- which would be the correct tool?

FIGURE 1: OMNISCIENT, INC. OICT is a likely trading candidate. But which analysis tool would most accurately predict the future price trend?ON PSEUDO SECURITIES
The development of the personal computer has been most responsible for the shift to a computational approach to technical analysis. In the rush to exploit the power of this new tool, however, we must take a leap of faith regarding the overall efficacy of machines and methods. Pseudo securities -- waveforms -- like the fictitious Omniscient are a deceptively simple bridge concept that may help reduce some of the risk involved.
Most technical analysts learn their craft backward; the potential of technical analysis is so patently obvious that we tend to rush in to use existing analysis tools, only fine-tuning afterward. Just how well these tools work, and how to tune and apply them appropriately, may be lost in the noise created by rushing in to apply them to real historical data.
Pseudo securities are a different kind of subject for our tools, in the form of price-and-volume idealized analogs to real securities. With pseudo securities, we may test and more fully understand the cause and effect relationships between price variation inputs and the output waveforms that many popular indicators produce.
These input waveforms may consist of single or multiple geometric shapes, such as the rectangular wave charted in Figure 2, the triangular wave shown in Figure 3, single or multiple sinusoids as shown in Figure 1, or combinations of the basic forms. Because these waveforms are idealized, they are devoid of confusing noise. The waveforms are generated in a spreadsheet, such as Excel.
In analyzing pseudo securities, the technician continues to do what he or she has been doing; it's simply a change in focus. Because of the enhanced perspectives they provide, pseudo securities make an excellent starting point for developing indicators and, by extension, database filters and trading systems. The moving average is frequently used as an example in this article because it is the mathematical tool most directly and indirectly used in technical analysis today.
Only a few basic patterns are described here, but these same concepts and techniques may also be extended to build examples of almost any market pattern. Pseudo securities are not tools with which to analyze; rather, they should be considered a cutting-edge tool sharpener.