TRADING TECHNIQUES
How Smooth Is Your Data Smoother?
by Patrick E. Lafferty
Traders use moving averages to remove random fluctuations from price data. Some moving averages work better than others. Take a look.
In 1995, I wrote an article for STOCKS & COMMODITIES presenting some of the properties of three methods for removing random noise from financial time series. I discussed the lags between the turning point of a simple test data sequence and the turning points of three types of moving averages. I showed that for equal moving average periods, the three moving averages had markedly different lag characteristics. Specifically, for each period, an endpoint moving average (EPMA) had a smaller lag than an exponential moving average (EMA), and both the EPMA and EMA had smaller lags than the corresponding simple moving average (SMA).

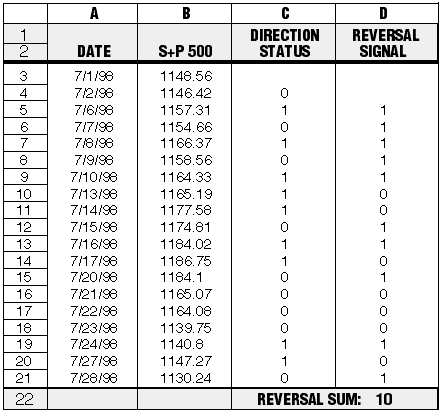
FIGURE 1: COUNTING REVERSALS IN EXCEL. It's easy to count data direction reversals using an Excel spreadsheet like the one here. This example covers a short run of S&P 500 closing prices between July 1, 1998, and July 28, 1998.While it is important to define the lag characteristics of a data smoother, there is another, even more basic, question that must be addressed about the performance of the smoothing function. How smoothly does the smoothing function smooth the data? How smooth is your data smoother?
WHAT IS SMOOTHING?
Before we can even begin to assess the smoothness introduced by various processes, we must define what we mean by smoothing. For our purposes, data smoothing will be defined as the process of reducing reversals in the direction of the dataset being studied. By way of illustration, let's consider the data direction reversals in the 7,254 daily closing prices of the Standard & Poor's 500 index between March 17, 1970, and November 30, 1998.
Over this period of 28-plus years, there were 3,332 instances when the direction of the daily change in the index was opposite to the direction of the change of the preceding day. If we divide the number of days in the dataset by the number of data direction reversals, we find the S&P 500 reversed direction, on average, every 2.18 days. Now, if we use an 11-day simple moving average to smooth the S&P dataset, the resultant dataset has only 883 reversals and changes direction, on average, every 8.21 days. Thus, in terms of data direction reversals, the moving average is considerably smoother than the original data.
We can further define the performance of the data smoother by calculating
the percentage difference between the average time between reversals for
the smoothed data and the average time between reversals for the unsmoothed
data. In the case just described, that would be:  Thus, we might say that the smoothed data is 277% smoother than the unsmoothed
data.