More than a decade ago, we noticed that a recurrent pattern could be seen on the charts of individual stocks as well as on the indices. Roughly 90 calendar days after the occurrence of a large, sudden, strong move (mostly upward but sometimes down), there would be a fairly good probability that another such move would occur. The quarterly timing suggested that the pattern was induced by the occurrence of surprises (for example, earnings surprises) associated with corporate reports. When this pattern was present -- and it frequently was -- it was quite dramatic: It could be used to predict turning points in stocks (as well as in stock indices such as the Standard & Poor's 500 index) months ahead with a fair degree of accuracy.
TRADING TECHNIQUES
Trading Stocks With A Cyclical System
by Jeffrey Owen Katz, Ph.D., with Donna L. McCormick
There may be a tradable pattern in individual stocks and indices. Read about one way to systematically look for and track this cycle.

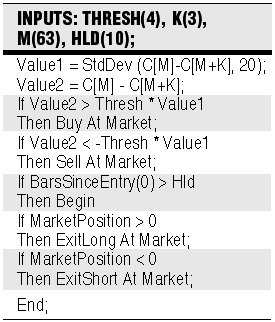
This forecasting pattern produced such good results that we developed and marketed software based upon it: NexTurn for the S&P 500, and The Stock Analyzer for individual stocks. Several years after we discovered it, however, the pattern disappeared from the indices, and the software became moot.FIGURE 1: SYSTEM RULES. The rules of this system, which were written in Easy Language, can be seen here.
Neither NexTurn nor The Stock Analyzer were complete trading systems; they had no entry or exit orders but merely generated signals. Let's see whether we can develop a successful trading system for stocks based on the pattern we observed more than a decade ago. We will be working in TradeStation and fully disclosing all trading logic and Easy Language source code.
DEVELOPING THE TRADING SYSTEM
How can the 90-day rhythm pattern be used to form the basis of a complete trading system? In NexTurn and The Stock Analyzer, signals were generated by looking at the three-day rate of change 63 trading days ago. If, based upon such criteria, there was sufficient movement at the previous point, the software would generate a signal. When the rate of change was greater than a given threshold, a buy signal (up) was generated; when it was less than another given threshold, a sell signal (down) was generated. These signals were generated in anticipation that the thrust, either up or down, seen approximately a quarter previously, was about to be reenacted by the stock or index being studied.
The principle discussed here and used in our software can be used with some additional logic to construct a full trading system with both entry and exit orders, and even stops. The logic of the trading system would be as follows: First, compute the 20-bar standard deviation of the k-day rate of change m days in the past, and then compute the k-day rate of change as seen m days ago. Since trading days are used, m should be about 63 and k should probably be a small number between one and five (in NexTurn, it was three).