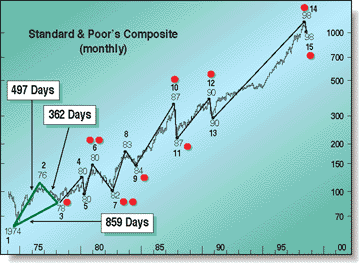
Three important turning points between 1974 and 1978 have influenced the growth pattern of many subsequent major and minor market moves, up to and including the July 20, 1998, peak and the September and October 1998 lows for the Dow Jones Industrial Average (DJIA) and the Standard & Poor's 500, respectively. Here's how the triangle in Figure 1, which connects the 1974 low for the S&P 500 index with the 1976 peak and 1978 low, have influenced these subsequent market moves. The triangle seen here connects points 1, 2, and 3 from Figure 2. The points in Figure 1 and 2 are those moves analyzed in this article.
MARKET TIMING
Log Spirals In The Stock Market
by William T. Erman
The basic mathematical characteristic of the log spiral is that even while increasing or decreasing in size, the log spiral remains constant. This is also true for rectangular spirals, the parameters of which are determined by their related log spirals. Many major market moves share the properties and predetermined progression of these spirals, indicating the close correlation between multiple manifestations of the ordered form of nature and the architecture of markets themselves.

THE CASE FOR ORDERFIGURE 1: SPIRAL GROWTH PATTERNS. Points 1, 2, and 3 are connected, forming a triangle. These points influence the growth pattern of many subsequent major and minor moves in the market. The dots represent those moves examined in this article.
Before proceeding to the examples, let us review two schools of thought regarding order in the markets and some properties of log spirals. Technical analysis has made amazing progress since the advent of computers, but this progress has not quieted the debate between random walk proponents and advocates of mathematically ordered markets. Random walk supporters cite the millions of subjective, individual decisions and unpredictable fundamental events as sufficient reasons for the impossibility of ordered markets. The opposing philosophical argument in support of orderly markets is based on the following:
- Market moves are the result of the psychological factors translated into market moving decisions by the aggregate of participants. The participants are human beings.
- Humans are indisputably a part of nature.
- As a product of humankind, markets are as inherently natural as thousands of geometrically perfect honeycombed beehives produced by billions of bees.
- From the atom, to living organisms at every level, to the farthest extent of the cosmos, nature exhibits the ability to create order out of an infinite number of seemingly chaotic inputs. Order endures, unscathed by a perpetual barrage of potentially disruptive influences.
One of the best-known examples of orderly progression in nature is the nautilus mollusk; a half-section view of its shell can be seen in Figure 3. As its growth forces the shell to increase in size, the essential shape of the shell never changes. The radius increases proportionately as the shell grows longer. Successive increments of growth are united by a constant, common ratio of expansion.