Our focus this month in Traders' Tips is on the cup-with-handle chart pattern that Rick Martinelli and Barry Hyman explored in the October 1998 Stocks & Commodities in "Cup-with-handle and the computerized approach." When all the criteria fall into place, this chart pattern really seems to pick out some nice bullish breakouts. I must caution you, though, that as with most chart patterns, the cup-with-handle formation is subjective. In other words, the pattern defined for the computer program may not recognize some legitimate cup-with-handle formations or may display a pattern where one does not truly exist. Thus, in setting up the EasyLanguage indicator below, I have tried to strike a balance between the two extremes.
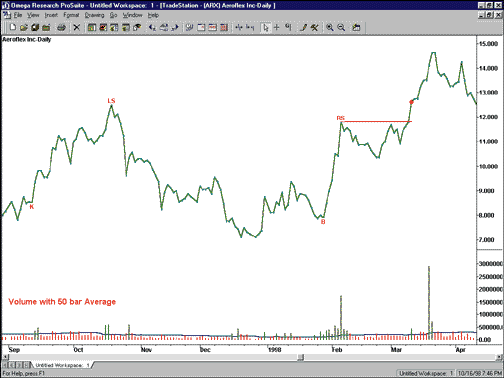
The name of the EasyLanguage indicator described here is "cup & handle." When the indicator identifies a cup-with-handle formation, it will place the following characters on the chart for identification of the key points:
K: Beginning of the setup phase
LS: Left-hand side of the cup formation
RS: Right-hand side of the cup formation
B: Bottom of the cup
Once the key points have been identified, the indicator will also plot a horizontal line at the level of the right-hand side of the cup. The horizontal line will continue to plot until either the upward price breakout occurs or the close falls below the acceptable level. If an upward price breakout occurs, a red dot will be plotted at the close (Figure 1).

FIGURE 1: CUP-WITH-HANDLE. Here is an example of the pattern shown in TradeStation.
This indicator will generate an alert for two situations. The first is when a valid cup-with-handle formation has been identified. The second is when a price breakout above the right-hand side of the cup formation has occurred. "AlrtLen," the only input for this indicator, determines the number of bars after the occurrence of either of the two above criteria that an alert will be generated.
To create the cup-with-handle indicator, you can use the following EasyLanguage code:
Name: Cup & Handle
Type: Indicator
Inputs: AlrtLen(4);
Vars: SH(0), LftSide(0), LftLen(0), B(0), CC(0), AvgVal(0), Cup(False), CupBar(0), RgtSide(0), HiVolume(0), AvgVolume(0), CHP(0), KBar(0), RS(0), RSLine(0), AlertReset(0);
SH = SwingHigh(1, Close, 1, 2)[2];
AvgVal = Average(Close, 5);
IF AvgVal > AvgVal[1] Then
CC = CC + 1
Else
CC = 0;
HiVolume = Highest(Volume, 5);
AvgVolume = Average(Volume, 50);
IF SH <> -1 AND HiVolume > AvgVolume[2] AND
Highest(Close, 3) <= SH Then Begin
LftSide = SH;
LftLen = 0;
For value1 = 145 DownTo 25 Begin
IF Close[value1] >= LftSide AND
HiVolume[value1-2] > AvgVolume[value1] Then Begin
LftSide = Close[value1];
LftLen = value1;
End;
End;
IF LftLen <> 0 Then Begin
IF Highest(Close, LftLen-8)[4] < SH Then Begin
CHP = Text_New(Date[LftLen], Time[LftLen],
Close[LftLen], "LS");
Text_SetStyle(CHP, 2, 1);
CHP = Text_New(Date[3], Time[3], SH, "RS");
Text_SetStyle(CHP, 2, 1);
B = Close[CC[3]+3];
CHP = Text_New(Date[CC[3]+3],Time[CC[3]+3],B,"B");
Text_SetStyle(CHP, 2, 0);
IF Lowest(Close, 35)[LftLen] <= B Then Begin
KBar = LowestBar(Close, 30)[LftLen];
CHP = Text_New(Date[KBar],Time[KBar],Close[KBar],"K");
Text_SetStyle(CHP, 2, 0);
Cup = True;
CupBar = BarNumber[3];
RgtSide = SH;
AlertReset = 0;
RS = SH;
RSLine = TL_New(Date[3], Time[3], RS, Date, Time, RS);
End;
End;
End;
End;
IF Cup AND BarNumber > CupBar + 3 Then Begin
TL_SetEnd(RSLine, Date, Time, RS);
IF Close < (RgtSide*.80) Then
Cup = False
Else
IF Close > RgtSide AND Volume > AvgVolume Then Begin
Plot1(Close, "C&H_Brkout");
AlertReset = 0;
Cup = False;
End;
End;
AlertReset = AlertReset + 1;
IF AlertReset <= AlrtLen Then
Alert = True;
The indicator should be formatted using the following settings:
Style:
Plot Name Type Color Weight
Plot1 C&H Brkout Point Red Thick
Scaling:
· Same as Price Data
Properties:
· Enable Alert
This EasyLanguage code is also available at Omega Research's Web site. The filename is "CupHndl.ELA." Note that all Traders' Tips techniques that are posted at the Omega Research Web site can be utilized by either TradeStation or SuperCharts. Whenever possible, the posted techniques will include both Quick Editor and Power Editor formats.
-- Gaston Sanchez, Omega Research Inc.
800 422-8587, 305 270-1095
Internet: https://www.omegaresearch.com
GO BACK
Here's a TechniFilter Plus report that implements Rick Martinelli and Barry Hyman's technique for screening for cup-with-handle patterns, as discussed in the October 1998 STOCKS & COMMODITIES in "Cup-with-handle and the computerized approach." While TechniFilter Plus has a cup-with-handle report in its library, the report given here implements the specific requirements given by Martinelli and Hyman. This report is necessarily complex, as it has to find both by value and location five different points, as well as impose constraints on the relationships among these 10 values.
The formula labels are tagged to the five points discussed in the article: K, A, B, C, and D. The "cup?" column imposes the constraints on the values and their locations. For stocks with current cup-with-handle patterns, the "filter for cup?" value will equal 1. The alpha, beta and gamma values are not meaningful unless the "cup?" value is equal to 1.
NAME: CupTASC
UNITS TO READ: 150
FORMULAS----------------------------------
[1] Symbol
[2] PointA
( H* (H>HY1)* ((CU13Y000-CU13)>26) )M130
[3] LocA
(H* (H>HY1)* ((CU13Y000-CU13)>26))M'130
[4] PointK
( LN30 * (H=[2]) )U31
[5] PointC
( ( (CU13Y000-CU13) < [3]Y000 ) * ( (CU13Y000-CU13) >4 ) * H*(HZ3U31<>[2]) )M0
[6] LocC
( [5]=H )U8
[7] PointB
( (( (CU13Y000-CU13) < [3]Y000 ) * ( (CU13Y000-CU13) > [6]Y000 ) * L) + (T=0)*100000 )N0 - (T=100000) * 100000
[8] LocB
( [7]=L )U8
[9] PointD
( ( (CU13Y000-CU13) < [6]Y000 ) * ( (CU13Y000-CU13) >2 ) * L + (T=0)*100000 )N0 - (T=100000) * 100000
[10] LocD
([9]=L)U8
[11] alpha
[1]: (C-CY1)*V
[2]: ([1]U4 * ( (CU13Y000-CU13) < [[8]]Y000 ) * ( (CU13Y000-CU13) > [[6]]Y000 ) )F0 / ([1]U1 * ( (CU13Y000-CU13) < [[8]]Y000 ) * ( (CU13Y000-CU13) > [[6]]Y000 ) )F0
[3]: ([1]U5U0 * ( (CU13Y000-CU13) < [[8]]Y000 ) * ( (CU13Y000-CU13) > [[6]]Y000 ) )F0 /([1]U2U0 * ( (CU13Y000-CU13) < [[8]]Y000 ) * ( (CU13Y000-CU13) > [[6]]Y000 ) )F0 [4]: [2]/[3]
[12] beta
[1]: (C-CY1)*V
[2]: ([1]U4 * ( (CU13Y000-CU13) < [[8]]Y000 ) * ( (CU13Y000-CU13) > [[6]]Y000 ) )F0 / ([1]U1 * ( (CU13Y000-CU13) < [[8]]Y000 ) * ( (CU13Y000-CU13) > [[6]]Y000 ) )F0
[3]: ([1]U5U0 * ( (CU13Y000-CU13) < [[6]]Y000 ) * ( (CU13Y000-CU13) > [[10]]Y000 ) )F0 / ([1]U2U0 * ( (CU13Y000-CU13) < [[6]]Y000 ) * ( (CU13Y000-CU13) > [[10]]Y000 ) )F0 + (T=0) * [1]A50 [4]: [2]/[3]
[13] Cup?
( [9] > (.8*[5] +.2* [7]) ) * ([3]>[8]+20) * ([8]>[6]+3) * ([6]> [10]+2)
[14] gamma
[11]U0U6U9 + [12]U0U6U9 + [2]/[4]
This TechniFilter Plus strategy and the reports, strategies and formulas of earlier TradersÕ Tips can be downloaded from RTRÕs Web site.
-- Clay Burch, RTR Software
919 510-0608
E-mail: rtrsoft@aol.com
Internet: https://www.rtrsoftware.com
GO BACK
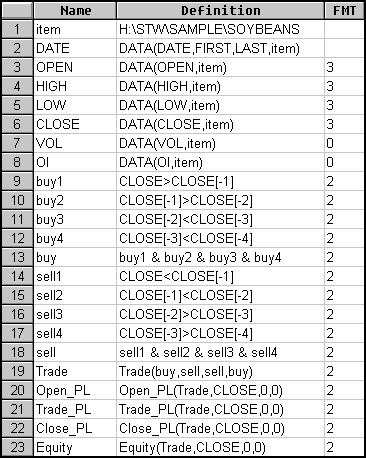
Here is a simple system for identifying tops and bottoms in the market using SmarTrader. The premise of this system is that a bottom occurs in a five-bar group when the close two days ago is less than the previous closes and they in turn are less than the preceding and following closes. This pattern represents a buy a signal. The reverse of these conditions, which signifies a top, is a sell signal.
Figure 2 displays the SmarTrader specsheet for this system. In row 9, "buy 1" is a conditional statement that determines if the close is greater than the close the day before. In row 10, "buy 2" determines if the close one day back is greater than the close two days back. In row 11, "buy 3" determines if the close two days back is less than the close three days back. In row 12, "buy 4" determines if the close three days back is less than the close four days back. In row 13, "buy" will be true only if "buy 1" through "buy 4" are true. The formula for this system could be done on a single row, but for readability, the system was formulated using a four-row view.
Rows 14 through 18 test for the reverse set of conditions to determine a top, and thus issue a sell signal.
CompuTrac Snap users can implement this system by removing the minus signs from within the brackets. This SmarTrader specsheet file is available from Stratagem Software's Web site.

FIGURE 2: SMARTRADER SPECSHEET. This SmarTrader specsheet identifies tops and bottoms in the market.
-- Jim Ritter, Stratagem Software International
504 885-7353, E-mail: Stratagem1@aol.com
Internet: https://members.aol.com/stratagem1
GO BACK
 TRADESTATION/SUPERCHARTS


 TECHNIFILTER PLUS


 SMARTRADER

