CLASSIC TECHNIQUES
Triangles
by David Vomund
When an existing trend is in the process of ending, there is typically some backing and filling, during which a classic technical pattern referred to as a triangle often develops. There are many variations of this pattern, but here, we will concentrate on two variations: the right triangle and the symmetrical triangle.
THE RIGHT TRIANGLE
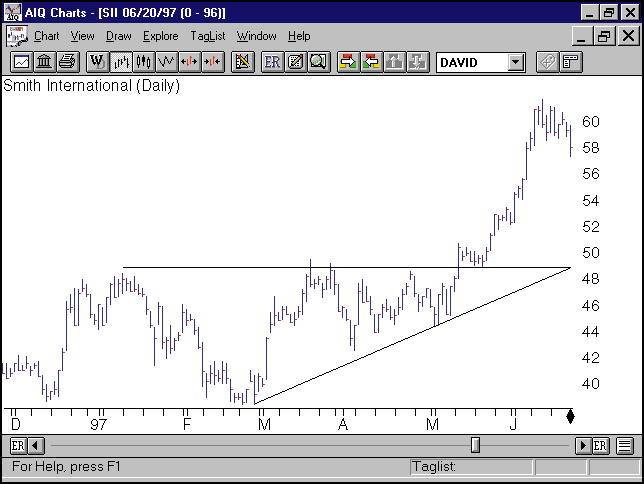
The right triangle pattern exhibits a series of narrower price fluctuations. On one side of the fluctuation, the boundary of price action is horizontal. On the other side, prices fluctuate toward the horizontal boundary. An ascending triangle is a right triangle with a horizontal top and an ascending bottom. A descending triangle is the reverse. To illustrate, let's look at Smith International [SII] in Figure 1. Early in 1997, SII began to form an ascending triangle. The resistance level was at $49 and the stock sold off every time it reached this point, yet each selloff was smaller than the previous one.
Now, remember that a trendline is drawn at the extremes of a pattern. For each trendline, at least two price points must be connected before the stock breaks out. In early May, SII was able to clear that resistance hurdle, which was the buy point. After the ascending triangle, SII staged an impressive advance. The stock rallied until October, at which time it reversed direction. As the uptrend was ending, a descending triangle pattern developed; the $73 level was support for the stock, but each rally from this level was less than the previous rally. In November, SII fell below its lower trendline. Clearly, the uptrend was over. As often happens with trendline breakouts, SII rallied and tested the level where the breakdown occurred. The horizontal trendline was support, but once the stock fell below it, it became resistance. SII was unable to break above this level and the downtrend resumed.

FIGURE 1: ASCENDING TRIANGLE. Here is an ascending triangle pattern in SII where the buy occurs when the stock rises above its upper resistance line. SII broke above $49 and then retested its breakout before staging an impressive advance.
Chart analysis plays a critical role in technical analysis but like any other tool, it is not perfect.
David Vomund is the chief analyst at AIQ Systems (https://www.aiq.com) and publisher of the weekly Vis Alert newsletter.